Mixpanel and Amplitude are two of the most widely used product analytics platforms for understanding how users interact with digital products.
Both platforms use event-based tracking to analyze user behavior, but they differ in areas such as reporting depth, experimentation capabilities, pricing models, and governance approaches. Choosing between them depends on how your team plans to collect, analyze, and act on product data.
At McGaw, we’re experienced in using and implementing both tools. We’re certified partners of Amplitude and Mixpanel, and we regularly recommend them to support the growth of our clients.
Both platforms have their strong and weak points. However, our recommendation always depends on the client’s goals and the resources they have in place.
This blog post highlights the similarities and differences between Amplitude and Mixpanel to help you choose the right one for your business.
Key Takeaways
- Both Mixpanel and Amplitude are strong event-based product analytics platforms.
- Both support core workflows like funnels, cohorts, retention, and segmentation.
- The biggest differences typically relate to ecosystem approach, governance capabilities, analytics workflows, and how teams prefer to explore and align on metrics.
- Pricing models vary and can change the long-term cost profile depending on your user volume and tracking design.
- The right choice depends on your team’s goals, maturity, and the resources available for instrumentation and ongoing analytics.
Contents
Contents
Mixpanel vs. Amplitude: Solving the Same Problems, Different Philosophies
Both Mixpanel and Amplitude began by solving the same core problem. Product teams needed better visibility into how users behave inside digital products such as web and mobile applications. Traditional analytics tools focused on pageviews. Product teams needed event-level insight tied to user identity.
Both platforms adopted an event-based model. Every meaningful user action becomes a trackable event. That foundational similarity remains today.
Over time, however, their philosophies diverged.
Amplitude has steadily expanded toward becoming a broader digital growth platform. In addition to core reports like funnels, cohort analysis, and event analysis, Amplitude invested in advanced reports powered by machine learning.
Examples include:
- Personas, which clusters users based on behavioral similarity
- Compass, which identifies usage thresholds correlated with long-term retention
- Impact Analysis, which measures the business impact of launching new features
Several of these reports, such as Engagement Matrix and Personas, have no direct equivalent in Mixpanel.
Amplitude also expanded beyond pure product analytics. The platform now includes:
- A full A/B testing suite including a visual editor
- A visual experiment editor for web
- Session replay
- Heatmaps
- Product guides
- Significant AI investments including agents and MCP-style capabilities beginning in 2025
From a market perspective, Amplitude has a strong enterprise presence. Their public reporting emphasizes enterprise account growth and highlights brands such as Walmart, DoorDash, Adidas, and Capital One. While Amplitude serves startups and mid-market teams, product decisions often reflect enterprise governance, scale, and complexity.
Mixpanel has taken a more focused route.
Mixpanel has also expanded beyond product analytics with targeted investments in non-analytics functionality such as session replay, heatmaps and metric trees.
In recent years, Mixpanel emphasized:
- Metric Trees, which help teams connect product metrics to strategic business outcomes
- Session replay including server-side support
- Heatmaps
- Feature Flags
- Experiments (no visual editor yet)
- AI features such as MCP and more in the pipeline such as an AI copilot
From a market positioning standpoint, Mixpanel also has a major enterprise focus while providing self-serve plans for startups and SMBs.
Amplitude vs. Mixpanel Use Cases
We regularly recommend both Amplitude and Mixpanel to our clients at McGaw. Each platform can support strong product analytics workflows, but the right choice usually depends on a company’s goals, team structure, and data maturity.
Real Thread
Real Thread is a custom apparel printing company based out of Florida. They approached us with the idea to get more net new customers.
When we took a deeper look at their business, we saw that they were not making the most of their leads because their marketing and sales tools were not properly communicating with each other.
By recommending Amplitude’s free tier, they enabled different tools to talk to each other, and turned hundreds of leads per month into marketing qualified leads (MQL).
Forks Over Knives
For Forks Over Knives , the #1 resource for plant-based living, we recommended Mixpanel. They saw a 400% increase in conversions by analyzing drop offs, brainstorming ideas and measuring results within Mixpanel.
Mountain Goat Software
Mountain Goat Software is an education company providing certified scrum master and agile training. A large share of their customers’ user path was happening across devices.
We recommended Amplitude because we prefer their identity resolution between anonymous and logged-in user states.
BitFountain
BitFountain grew from 0 to almost $2M in less than 2 years. They had a lot of traffic but were having conversion problems.
We recommended that they use Mixpanel to make data-driven marketing decisions. With Mixpanel, we were able to uncover data that led to a change in brand messaging. We also identified that Facebook was best for nurturing customers and Twitter was best for gaining new users.
Comparing Mixpanel and Amplitude Features
Both Amplitude and Mixpanel are powerful software solutions that have some similar features.
Self-serve Product Analytics Platform
Both Mixpanel and Amplitude are built as self-serve analytics tools. They are designed so that product managers, marketers, and growth teams can build reports without needing constant SQL support from engineering.
Both tools offer the four core reports every product needs, which are:
- Event analysis
- Funnel analysis
- Cohort analysis
- Retention reporting
Amplitude has expanded beyond the four core reports and it provides 15+ reports including additional advanced reports that Mixpanel does not offer directly. One downside of the higher number of reports is that you team will require more training to properly understand all 15+ reports.
Mixpanel includes Metric Trees, which provide a structured way to visualize how top-level business metrics connect to product-level inputs. This is particularly useful for executive alignment.
If your team primarily needs strong funnel analysis and cohort reporting, both platforms perform well.
If your team wants built-in behavioral clustering and more sophisticated reports, Amplitude offers more out of the box.
If your team values structured metric alignment tied to business goals, Mixpanel’s Metric Trees provide a differentiated approach.
Event-based tracking
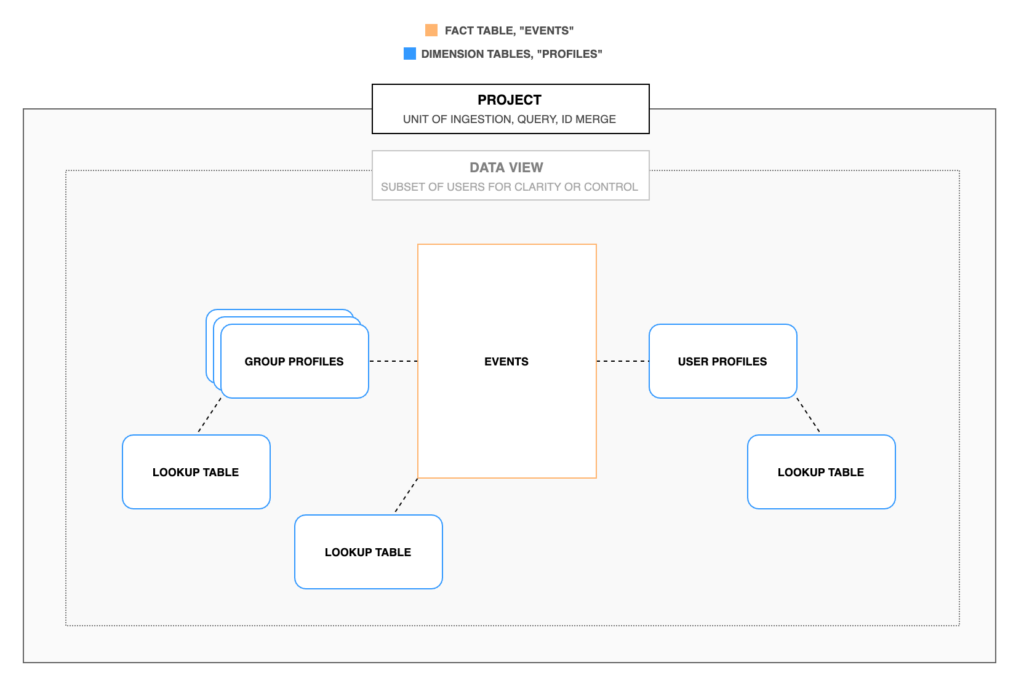
Both Mixpanel and Amplitude use an event-based analytics model. In this model, every meaningful user action inside an application is captured as an event, allowing teams to analyze product usage, user journeys, and behavioral patterns at the individual user level.
Examples include:
- Signed up
- Completed onboarding
- Added to cart
- Used feature X
- Upgraded plan

Both platforms:
- Store data at the individual user level
- Allow you to view the complete history of actions taken by a user
- Combine event streams from web, iOS, Android, and backend systems
- Support tracking methods such as track, identify, and group
There is a technical difference worth noting.
Amplitude stores the value of user properties at the moment of event ingestion. This means historical property states are preserved alongside events. One downside of this approach is that if you need to update historical user properties, you also need to send events.
Mixpanel also captures the historic states of event and user properties through its Arb database and then let’s you query historical values through its interface.
For teams analyzing behavior relative to changing user attributes over time, this distinction can matter.
-> Looking to see how GA4 compares to Amplitude? Read our Amplitude vs. GA4 Comparison: Tracking, UX, Integrations & Pricing article.
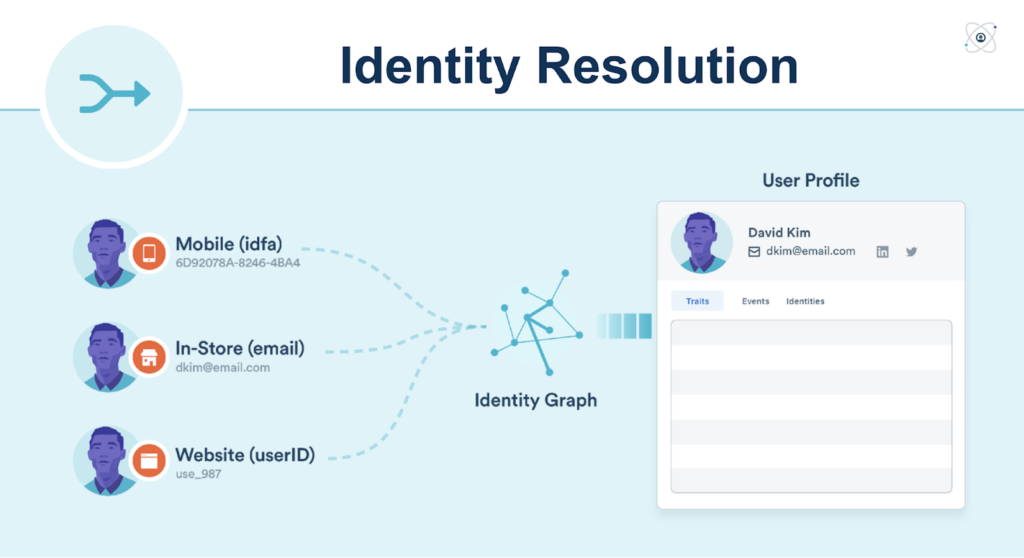
User Unification via Identity Resolution
Identity resolution is a core capability in product analytics platforms. It connects activity across devices, sessions, and anonymous visits into a single user profile so teams can analyze the full customer journey. With people accessing your product with various devices, you want to be able to identify a person as one and the same no matter what device they’re using or even if they’re browsing anonymously.
Both Mixpanel and Amplitude unify user activity across devices and sessions into a single user profile.
Mixpanel’s identification logic has evolved over time. If your account predates 2023, you should verify which ID merge system is currently active in your implementation.
Amplitude’s identification model has remained relatively consistent over the years.
At McGaw, we now consider both systems quite similar in their ability to unify users across devices and sessions when properly implemented.
Below is a diagram of Mixpanel’s identity resolution. Unique IDs are generated multiple times for the same user. When it gathers enough data, Mixpanel runs an algorithm to see if all these data points can be merged to identify one user.

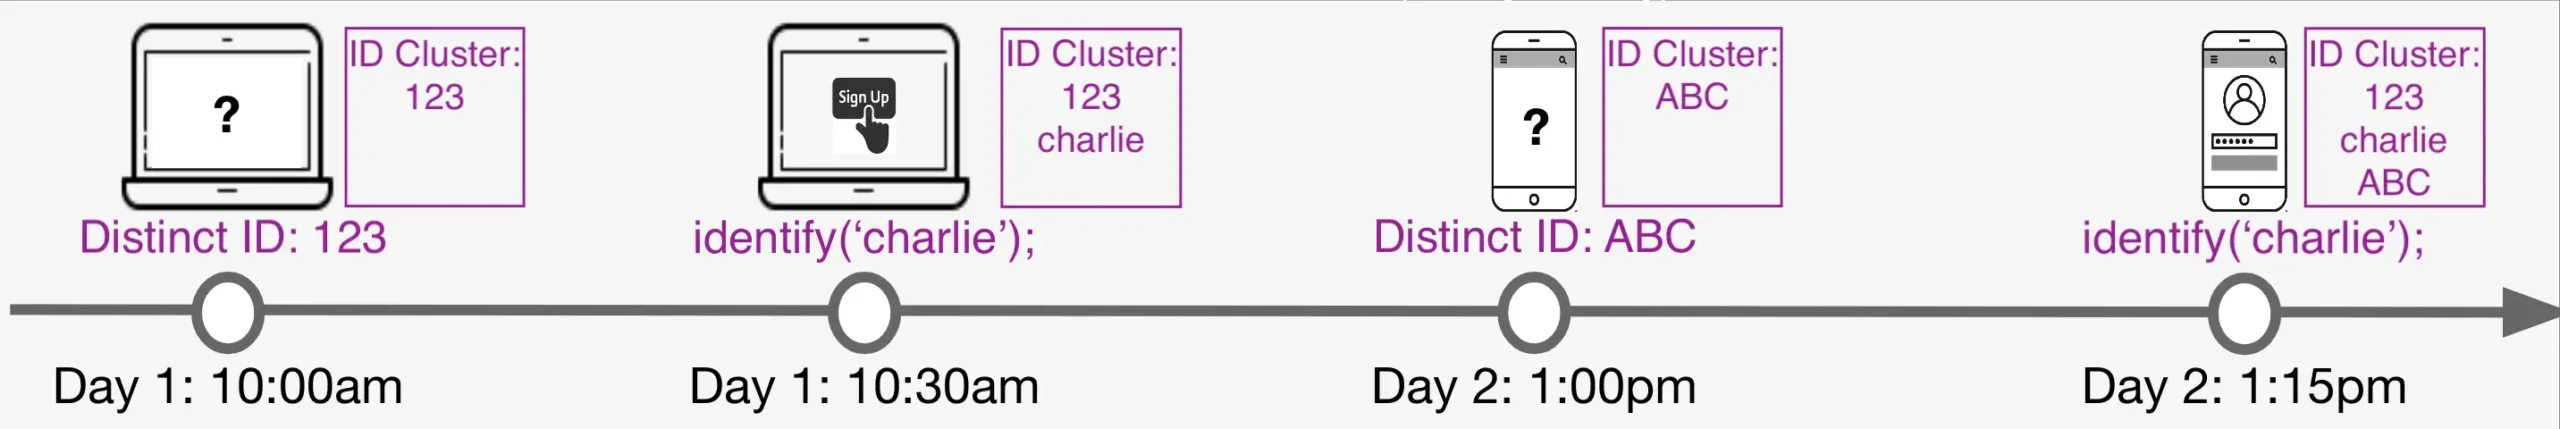
Amplitude’s identity resolution follows the same pattern except they track users using three different IDs: device ID, user ID, and Amplitude ID, a unique ID generated after gathering the device and user IDs. Using these three, they then infer whether a person can be merged into one user based on the activities recorded in these IDs.
Data Governance
To ensure high-quality data, both platforms have built-in features for data governance i.e. the process of ensuring consistency and data validity by keeping it clean and simple for everyone to understand.
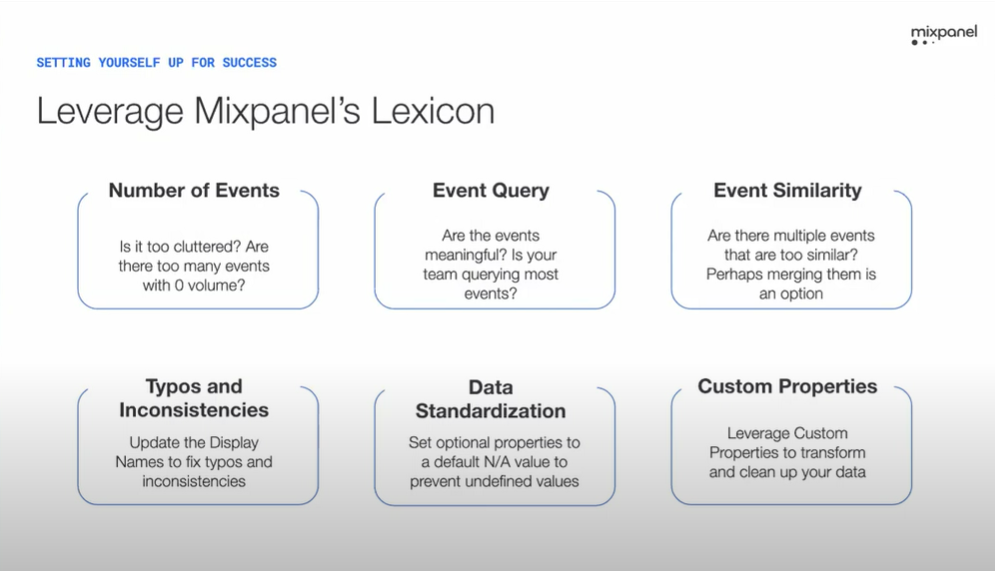
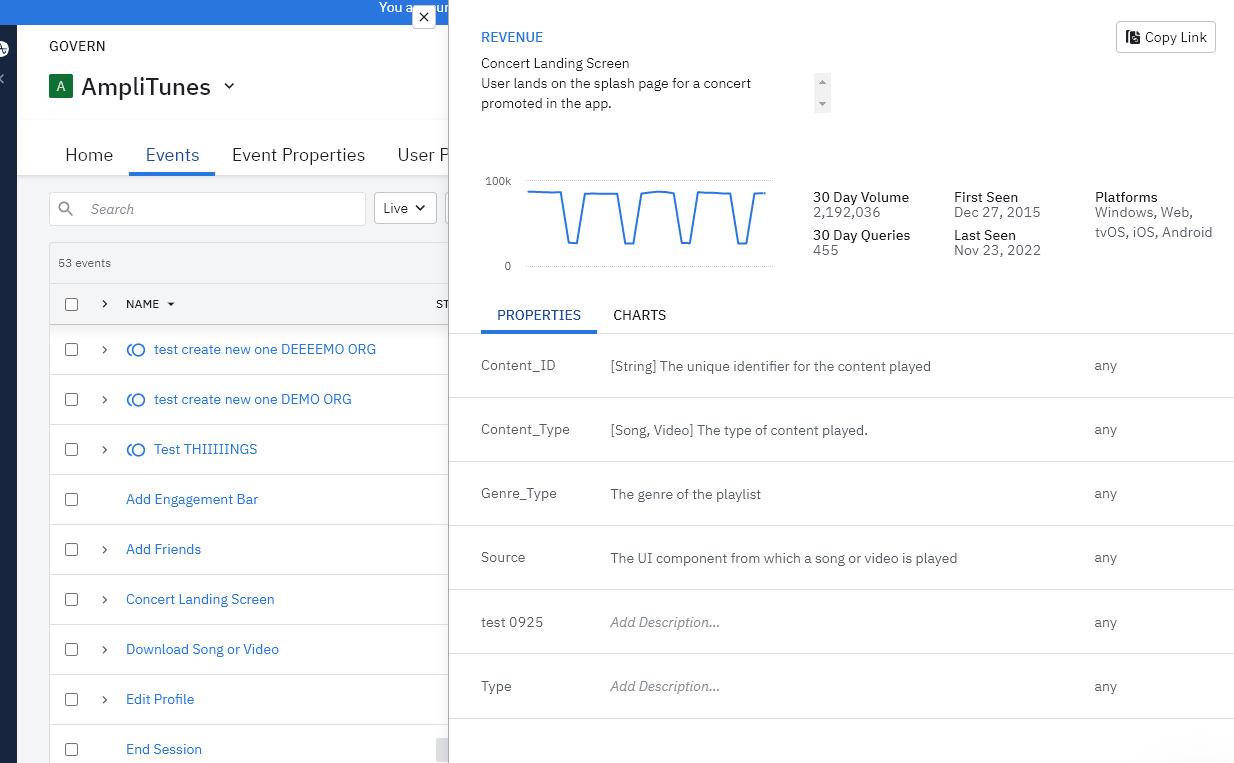
Mixpanel uses an interface called Lexicon. With Lexicon, any person with the right permissions can add and edit events, annotate, or make changes to any property without having a developer do it for them. With Lexicon, you can drop and hide events, as well as merge and tag reports. It also has a data audit feature that suggests changes you can make to optimize data governance.
Amplitude takes data governance seriously. As Ibrahim Bashir, Amplitude’s Vice President for Product Management says, “We fundamentally believe spending time on data management is a job that has to be done. If you don’t want to spend any time thinking about what’s worth tracking and why you’re tracking it, we think that’s a mistake.”
Unlike Mixpanel, Amplitude does not support updating or changing old events. That’s why data instrumentation is central to their philosophy as it is to us at McGaw
.
Although you can’t update or change old events in Amplitude, it has a governance feature (as does Mixpanel) to help you maintain the integrity of your data. The feature lets you bulk delete or block events and properties, mark an event as active or inactive, or change its visibility. It also helps you make the data taxonomy more accessible to everyone.
Dashboards and Reporting
With just a few clicks, you can customize the dashboards in Mixpanel and Amplitude.
Amplitude’s dashboard is very flexible. You can make your own or modify someone else’s plus add robust filter customizations. You can either filter each widget in the dashboard or filter all widgets at the same time. Amplitude’s dashboard is primarily for showing metrics. If you want to tell a story out of this data, then you use Amplitude Notebooks.
Mixpanel’s dashboard is more than just a dashboard. It’s also a data storytelling interface like a hybrid of Amplitude’s Notebooks and a dashboard. It’s customizable and allows you to visualize and present data in interesting ways. You can enrich the data with different charts, long-form text, pictures, or videos, so that individuals can convey reports and insights much better.
Integrations for Importing Data
Both Mixpanel and Amplitude integrate with common data sources including:
- Web SDKs
- Mobile SDKs
- Server-side APIs
- Customer Data Platforms such as Segment
- Data warehouses such as Snowflake and BigQuery (Mixpanel offer Mirror Mode, which is handy)
Both platforms support importing data via API and batch ingestion.
In practice, integration complexity depends more on your internal data architecture than on which analytics tool you select.
Collaboration
Both tools support collaboration features such as:
- Shared dashboards
- Saved reports
- Commenting on charts
- Role-based access control
Onboarding
How long it takes to fully implement Mixpanel and Amplitude depends on your resources and the complexity of your product. If you already have a data strategy in place, then this can be quicker. But if you don’t, you’ll still need to plan what events you need to track.
Amplitude states that it typically takes from 1 day to 3 weeks from kickoff to send production data to Amplitude. The first step is data instrumentation training. Then you create the event taxonomy and learn data-tracking best practices. Only after this will you be able to send production data to Amplitude. When this is done, your team undertakes training to learn more about Amplitude’s different features.

Mixpanel states that it takes about 30 minutes to implement a single tracked event in your product but a full implementation can take up to 3 weeks. They also say that most of their clients have a clear roadmap on or before day 10 and are finished by day 40. Their onboarding goes through four phases: The implementation kickoff where you learn about Mixpanel; data planning where you make your tracking plan; the implementation when you send production data, and lastly training on how to make use of your data.

Mixpanel vs. Amplitude: A Few Distinct Differences
As similar as many of Mixpanel and Amplitude’s features are, there are also several key differences.
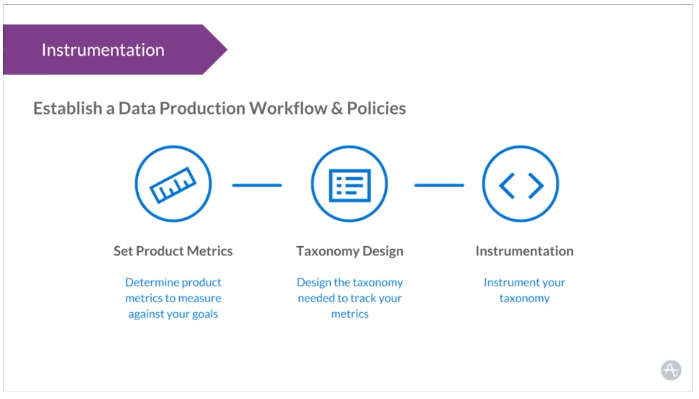
Data Instrumentation
Both Mixpanel and Amplitude believe data instrumentation is necessary for accurate analysis in use cases such as churn and retention reporting.. However, they approach this in different ways.
For Amplitude, it’s the very foundation of product analytics. Much of their onboarding ensures that you get your data right at the very beginning so that you don’t find yourself working with messy data. They also have their own CDP and have acquired Iteratively for data pipeline development.
Mixpanel also belives in getting your taxonomy right during onboarding but also understands that your data model can change as you discover new insights about your product. You can correct, append, and modify data, events, and properties as you’re using it.
A/B Testing and Experimentation
Both Mixpanel and Amplitude support experimentation workflows.
- Feature flagging
- Experiment tracking
- Deep integration between experimentation and analytics
Amplitude offers a visual editor for experiments while Mixpanel does not.
Amplitude assumes you will do all your experimentation within its platform while Mixpanel can integrate with a third-party tool for feature flags or even a full-blown experimentation software such as VWO.
Pricing
Pricing is often a major consideration when comparing Mixpanel and Amplitude. The two platforms use different pricing models, which can influence long-term costs depending on product usage and event volume.
As of February 2026:
Mixpanel charges primarily based on events.
Amplitude charges based on Monthly Tracked Users or events.
Mixpanel pricing:
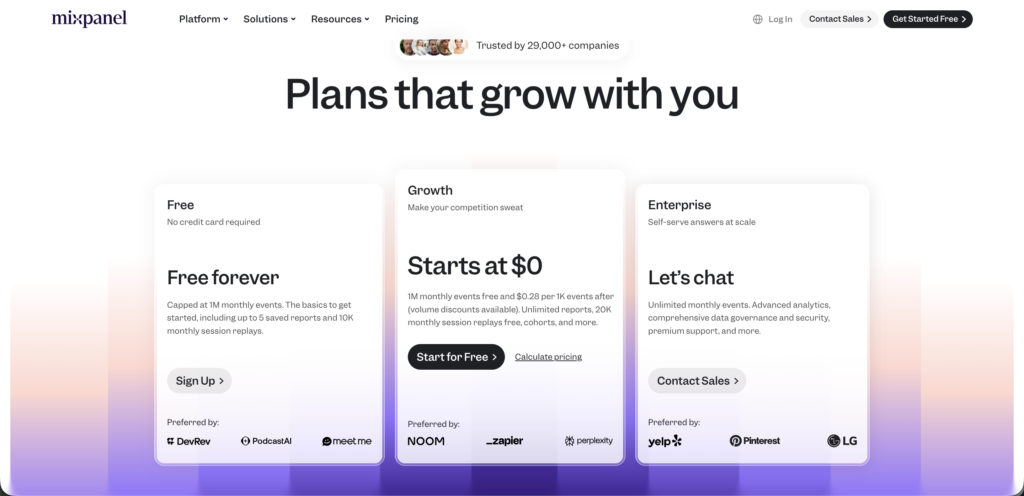
- 1 million free events
- 20K session replays
- Paid plans begin at approximately $140 per month for 1.5 million events
- Add-ons such as data pipelines may increase total cost
Amplitude pricing:
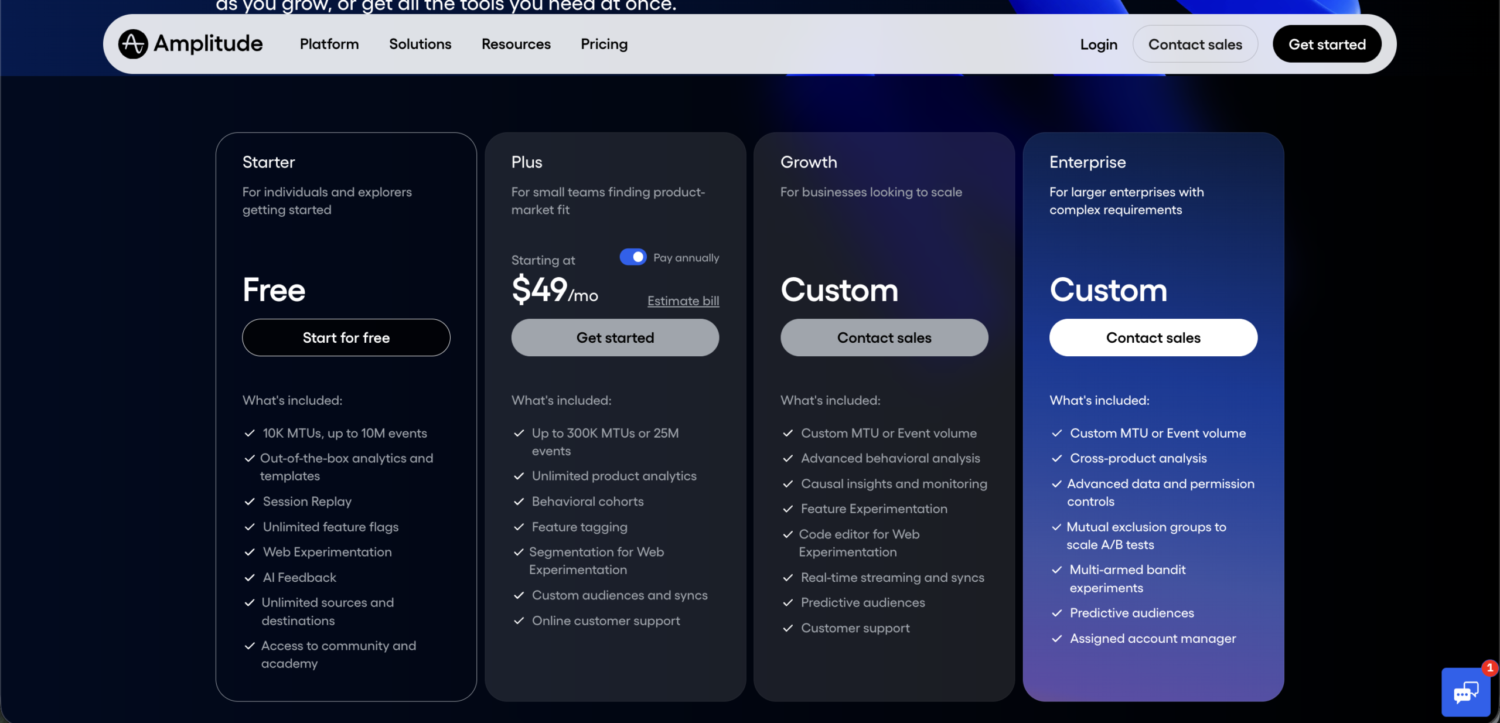
- 10K MTUs or 10 million events included in the free plan
- 10K session replays
- 10K MTUs on the Plus plan begins at approximately $186 per month
MTU pricing often fits B2B products with fewer users and higher value per user.
Event-based pricing can suit B2C products that carefully control which events are tracked.
In both cases, pricing modeling should be done before committing. Costs scale with volume and instrumentation design.
Mixpanel vs. Amplitude: How They’re Moving Forward
Mixpanel and Amplitude are both continuing to push the envelope in the analytics space. But they’re moving in different ways.
Amplitude
Amplitude is doubling down on AI.
Their roadmap emphasizes using AI to:
- Generate charts
- Analyze behavioral patterns
- Recommend experiments
- Potentially assist with instrumentation and data capture
The direction suggests Amplitude wants to reduce friction between insight and execution.
Mixpanel
Mixpanel is also focused on AI but believes you need good data and a strategic perspective to make the best decisions.
Metric Trees provide a top-down view of how core business metrics connect to product-level drivers.
Mixpanel also integrates session replay and heatmaps to help teams validate hypotheses quickly.
The emphasis appears to be clarity, alignment, and execution simplicity rather than platform expansion.
Mixpanel vs. Amplitude: Top Factors to Consider
When evaluating the two platforms, consider:
- Pricing expectations. MTU versus event pricing can create large long-term differences.
- The importance of AI features in your analytics workflow.
- The value of machine learning-driven reports.
- The learning curve for each tool (Mixpanel is less) and ease of implementation (similar for both tools)
- The need for structured metric alignment such as Metric Trees.
- The scale and governance requirements of your organization.
Final Thoughts
- Both platforms are strong event-based product analytics tools.
- Amplitude has expanded into a broader digital product growth platform.
- Pricing structure can significantly influence long-term cost.
- The right choice depends on your team’s size, maturity, experimentation needs, and data governance requirements.
Both Mixpanel and Amplitude are strong product analytics platforms. The right choice depends on your organization’s analytics needs, experimentation strategy, data architecture, and how your teams plan to use behavioral data.
At McGaw, we help companies design their analytics architecture, implement tools like Mixpanel and Amplitude, and ensure product data flows cleanly across marketing, analytics, and customer engagement systems.
If your team is evaluating product analytics tools or improving your marketing technology stack, reach out to our team who can help design the right data foundation.

I dig it! This is exactly the sort of information I’d want for a proper due diligence process for procurement and you guys make it so easy. Thanks 👍🏼
What would you say in 2022 Mixpanel vs Amplitude, especially if you use tools like Segment and customer.io?