
Quick Answer: Three patterns predict Segment CDP implementation ROI: writing a tracking plan before any code, resolving identity in week one, and integrating with the tool your team already uses every day. Teams that do all three ship in 45 days. Teams that skip them burn six months. Key ...
What a MarTech Stack Audit Actually Reveals (and What to Do About It)

Quick Answer: A MarTech stack audit most commonly reveals data fragmentation across disconnected tools, tool redundancy (30-40% of tools duplicating functionality), and broken identity resolution. These three findings appear in over 70% of the stacks McGaw has audited. A MarTech stack audit most ...
How a National Franchise Unified Data to Improve Media Performance
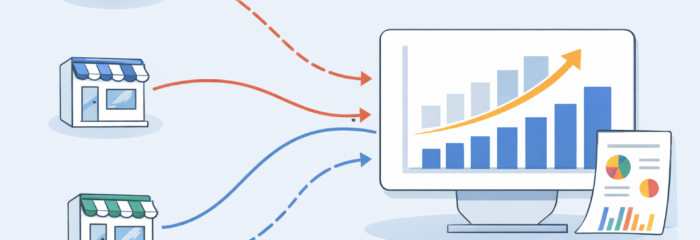
Franchise marketing data integration is the process of centralizing data from multiple agencies, platforms, and locations into one system so performance can be measured and optimized across the entire organization. Without this, brands cannot accurately compare markets, reduce wasted ad spend, or ...
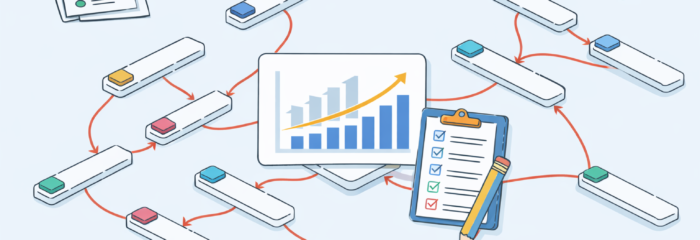
How to Audit Your Martech Stack in 2026: Find Revenue Leaks and Cut Waste

A martech stack audit is a structured review of your marketing tools, data flows, and reporting systems to identify what is broken, underused, or blocking growth. Done right, it reduces wasted spend, improves data accuracy, and gets campaigns out faster. Most companies find 30-50% of their tools are ...
Your Funnel Has a Leak. AI Can Now Find It in Minutes.

Quick Answer: AI funnel analysis connects AI to your live analytics data (Mixpanel or Amplitude via MCP) to find where users drop off and why — in minutes, not days. This post walks through the 5-step framework McGaw uses with clients. What Is AI Funnel Analysis? AI funnel analysis is the ...
How We Improved Ad Conversion Match Rates by Enriching HubSpot Lifecycle Data
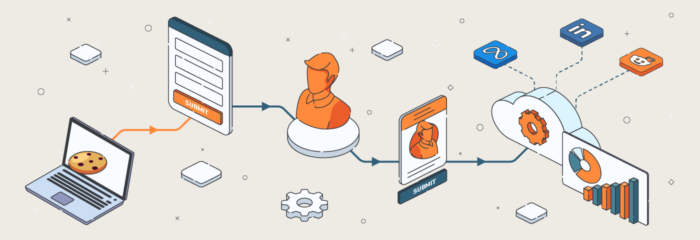
Quick Answer: Enriching server-side conversion events with browser context captured at form submission is the fastest way to improve ad platform match rates. Store Facebook _fbp, _fbc, Reddit identifiers, and user agent in HubSpot Contact properties using GTM, then forward that context through ...
Mixpanel vs. Amplitude: Complete Guide and Comparison
Quick Answer: Mixpanel excels at granular event-based analytics for product teams, while Amplitude leads in behavioral analytics with stronger AI-powered insights and collaboration features. Your choice depends on team size, data complexity, and whether you prioritize deep event tracking (Mixpanel) ...
The Elevator Ride That Changed How I Run Growth – VICE Framework
Quick Answer: The VICE framework is a data-driven prioritization framework that scores initiatives on four dimensions: Velocity (speed to results), Impact (potential business value), Confidence (certainty of outcome), and Ease (implementation effort). Each dimension is scored 1-10 and multiplied ...
How to Build a Martech Stack Diagram using Stack Builder
Quick Answer: A martech stack diagram is a visual map of every marketing tool in your stack, how they connect, and where customer data flows. Use McGaw’s free Stack Builder to auto-detect your tools via email domain scan, then drag and drop them into a layered diagram that shows your full data ...
What Most Companies Get Wrong When Choosing a CDP

CDP Selection Guide: How to Avoid the Expensive Mistakes Selecting a CDP is a high-stakes call. It affects your entire stack, your team’s workflow, and the quality of every decision you make. The wrong choice slows marketing down, burns budget, and forces you into manual workarounds. The right one ...
- 1
- 2
- 3
- …
- 17
- Next Page »
