
In today’s digital world, competition is fierce, and usability metrics are crucial for ensuring your product or service is good enough for the end user. After all, how can you actually understand the user experience without having reliable data to refer to?
This post will explore eight key usability metrics you need to keep track of to better understand the end user’s experience with your product. By tracking these metrics, you’ll understand your product’s effectiveness, efficiency, and satisfaction rate.
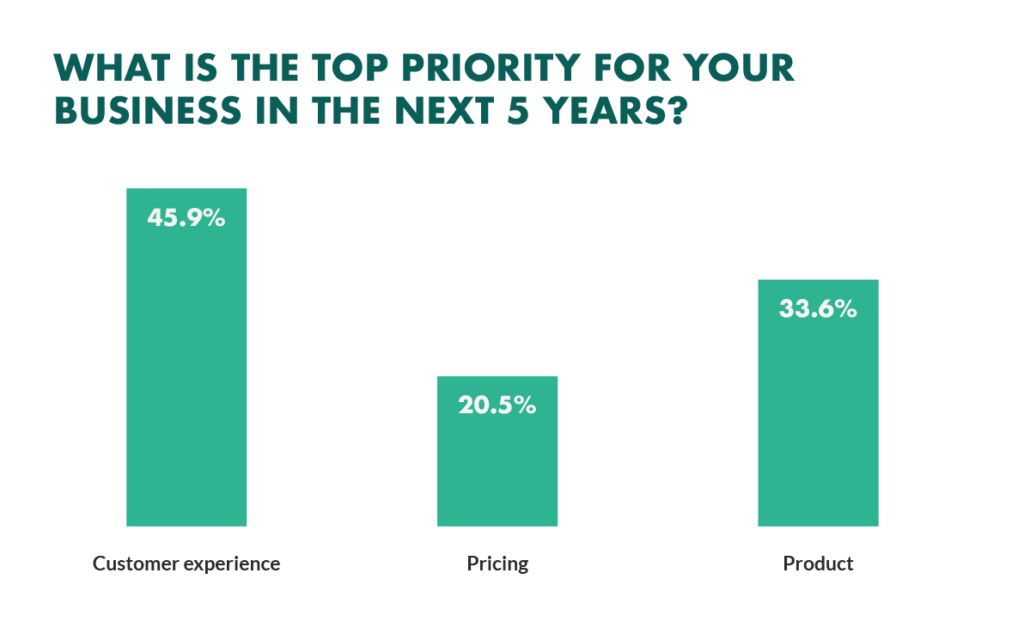
What Are Usability Metrics?
Usability metrics measure how easy and effective your product is for users. Keeping track of usability metrics allows you to gauge whether users can accomplish your product’s goals. They also highlight any issues with your product that need to be fixed.How to Measure Usability Metrics?
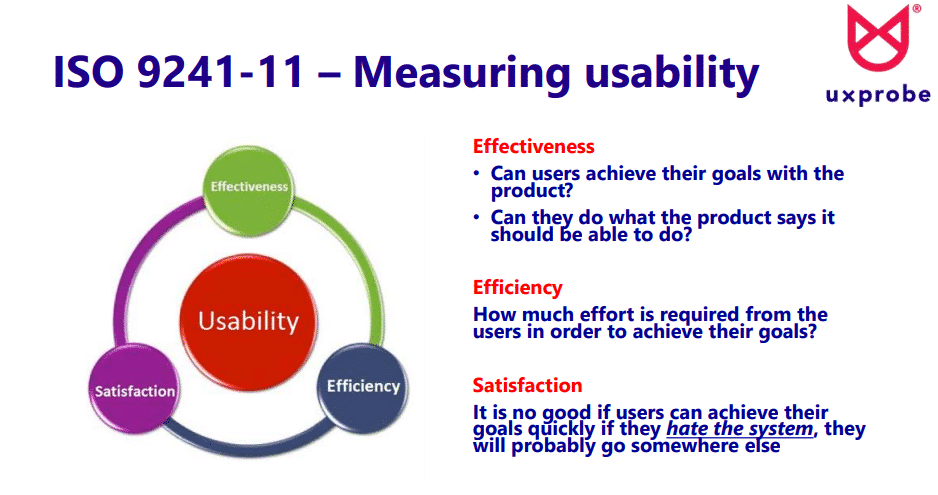
To properly measure usability metrics, you first need to plan everything out. The plan aims to get all the answers you need to maximize the usability of your product. It’s easier to specify metrics than it is to collect them, but they’re mostly centered around the user’s performance on a given list of test tasks. For example, measuring usability is defined as:
- The defined user(s)
- The defined task(s) to be performed
- The amount of time taken for the defined user(s) to perform the defined task(s)
- The number of errors produced by the defined user(s) undertaking the defined task(s)
Essentially, the faster users can perform tasks with minimal errors, the greater the usability.
Now that we’ve shown you what usability metrics are and how you can measure them, let’s take a look at eight core metrics you need to hit for maximum usability.
8 Key Metrics You Need to Track for Maximum Product Usability
1. Completion rate or the fundamental usability metric
The first usability metric is the completion rate metric. It’s also known as the fundamental usability metric, and both the terms can be used interchangeably.
The completion rate metric takes a sample of users and tests whether they complete or fail an intended task. These measurements are usually binary, meaning the answer is either ‘1’ for a completed task or ‘0’ for a failed task. The collected results give you a value for the completion rate.
Here’s a formula for working out the completion rate.
Formula:

For example, if you conduct 100 tests and 67 users manage to complete the task, the completion rate is 67%.
Utilizing the completion rate metric lets you quickly see whether your product is functional. If users are generally struggling with the usability of your product, it might be time to implement new A/B testing methods to get to the bottom of the issue.
2. Task duration
Measuring the task duration metric is one of the most important criteria for determining efficiency and productivity.
Task duration metrics are dependent on the purpose of the product or service you offer. A task with a longer duration can be a better result in some, while a short task duration can be better in other cases.
For example, a long task duration would be a bad result for a booking app, but for the reading time of a high-converting blog post, it shows engagement.
Formula:

3. The number of mistakes
In product usability, an error refers to a wrong action performed while completing a task. This usability metric focuses on the effectiveness of the product. Errors fall into two categories: mistakes and slips.
Mistakes happen when a completely wrong action is performed. For example, inputting an email address instead of a home address. Slips happen when the correct goal is performed, but there’s a slight error. For example, a slip could be a typo when entering a date of birth or name.
Monitoring these two error types highlights areas for improvement and possible ways to reduce input slips.
Formula 1:

Formula 2:

Don’t be disheartened by a small number of errors in your usability testing. Mistakes happen, and they aren’t always a reflection of your product.
4. Efficiency
Remember the task duration metric from above? Efficiency is intrinsically tied to task duration.
The efficiency metric combines task duration with success rates to assess the effectiveness and overall efficiency of the task. The following formula represents overall relative efficiency:

Suppose you have four users using your product to perform the same task (number of tasks = 1). Two users complete the task in four seconds, one user completes it in six seconds, and the final user takes eight seconds but fails to complete the task.
Following the equation above:
N = total number of tasks = 1
R = the number of users = 10
User 1: Nij = 1 and Tij = 4
User 2: Nij = 1 and Tij = 4
User 3: Nij = 1 and Tij = 6
User 4: Nij = 0 and Tij = 8
and the formula, you get:
Formula:

5. Single Ease Question (SEQ)
The single ease question (SEQ) is a seven-point rating scale determining how difficult users found a task. The SEQ should be completed immediately after the task to get a more reliable response. Ideally, you’ll want an overall score of 4.5 or more.
If you receive too many low scores, you’ll need to ask why to determine whether there’s an underlying issue that needs solving.
Formula:

6. System Usability Scale (SUS)
The system usability scale (SUS) is one of the best customer experience analytics solutions for gaining fast and reliable results.
The SUS consists of ten questions with five response options for each question. Responses range from strongly disagree to strongly agree. Feedback from these questions allows you to find where your product sits on the usability scale. These results can then be used to compare with competitors’ products.
7. Customer Satisfaction (CSAT)
The CSAT metric tells you how satisfied customers are with various aspects of your product. For most industries, it’s one of the most important metrics. CSAT surveys are helpful because they let you choose which questions to ask, meaning you gain reliable insights for specific questions.
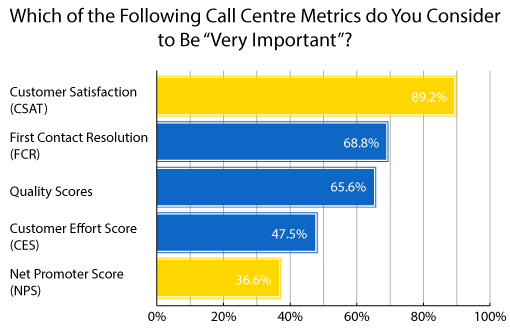
Here are some examples of good CSAT questions:
- Are you happy you purchased this product?
- Are you happy with the quality of the product?
- How would you rate the support options?
- Would you recommend the product to others?
Formula:

CSAT questions can be tailored for better insights. However, it’s worth noting that respondents might either love or hate your product, which misses out on those in the middle.
8. Search vs. Navigation
Users of your product, whether it’s an app, a domain page, a cloud service, or anything else, shouldn’t waste time navigating to find what they need. If they are using the search feature too much, it could indicate navigation problems.
Running a search vs. navigation assessment will indicate how easy it is to navigate your product. The user experience is improved when the search function is used less.
Formula:

Now that you know what usability metrics to track, let’s take a look at how to improve them.
Ideas for How to Improve Core Usability Metrics
There are many different ways to improve the core usability metrics, but we’ve singled out the two most exciting ideas.
Add short instructions or guidelines
Adding short instructions or guidelines is a simple and effective way to boost core usability metrics.
New users won’t have previous experience with your product. Therefore, users may initially find it hard to navigate and perform their intended tasks, which can affect the completion rate metric and task duration metric.
Whether it’s a tutorial via a video conferencing app, a PDF instructional guide, or a short online course, giving new users the support they need should boost the results of your usability metrics.
Remove unnecessary steps from processes
Today’s customers expect an optimized experience that requires as little input as possible. Removing unnecessary steps from processes should result in higher customer satisfaction and efficiency scores.
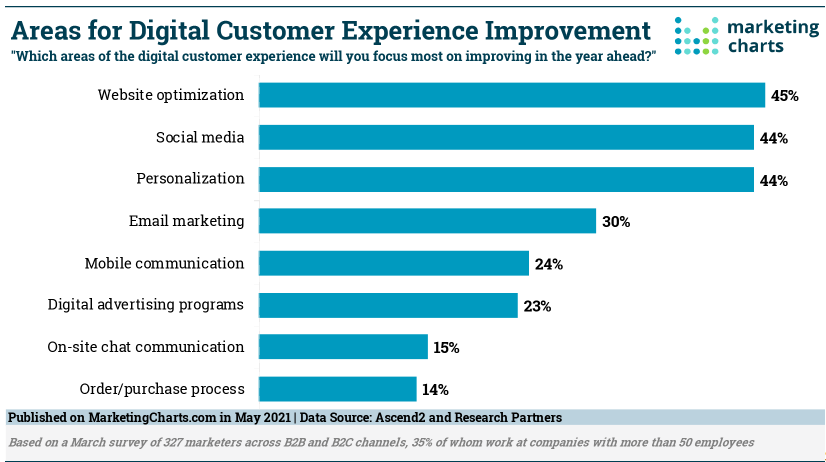
3 Benefits of Usability Metrics
You should work on improving your usability metrics because it can give you certain benefits — here are the most important ones.
1. You can maintain a record of progress between releases
Just because your product’s usability metrics looked good at launch, it doesn’t mean these results will continue to the next release.
Running usability metrics allows you to maintain a record of progress between releases. With tools for real-time reporting analytics, monitoring and adjusting your product’s usability is easier than ever.
2. They give you room to examine your competitive advantage
Collecting usability metrics gives you a benchmark to evaluate your competitive advantage over rivals. You’ll need to ensure you ask the right analytics questions, but having this benchmark allows you to stay one step ahead and provide a better product with ongoing support.
3. They help you with your stop/go decision before launching
Getting usability feedback from users helps you decide whether or not the product is ready for launch.
Negative feedback might indicate there’s more work to be done, whereas positive feedback might indicate your product is ready.
Conclusion
Usability metrics are crucial for getting user insights that will help inform better decisions about building and improving your product. Changing your design process could increase revenue when you better understand everything that’s happening with your product.
McGaw is a leading analytics and growth consultancy specialized in empowering marketing teams, boosting results and ROI, and streamlining your operations. McGaw will help turn your growth strategy and execution into a powerhouse.
Leave a Reply