
Last Updated on: September 16, 2026
Contents
- The model you pick decides which channel looks like a winner, which is why the argument about models is really an argument about budget.
- Single-touch models like first touch and last touch are easy to read and consistently wrong about the middle of the funnel.
- Multi-touch models are directional. Use them to optimize ad spend, not to report historical revenue to your board.
- Google reversed its third-party cookie deprecation plan in April 2025, so signal loss is now a browser-by-browser problem rather than a single deadline.
- Marketing mix modeling and incrementality testing answer questions multi-touch attribution cannot, and mature teams run more than one of the three.
What Exactly Is Marketing Attribution?
Marketing attribution is the practice of evaluating every marketing touchpoint a customer encounters on the path to purchase, then assigning each touchpoint a share of the credit for the conversion. Marketers use it to answer one question: which channels, campaigns, and messages actually moved someone to buy.
That definition is simple. Getting it right is hard. We treat marketing attribution as a measurement discipline, not a report you turn on, and the rest of this guide covers the models, the tools, the trade-offs, and the alternatives.
The main objective of marketing attribution is to determine which marketing channels and messages had the greatest impact on the decision to convert, or getting the prospect to take the desired next step.
Who Needs Marketing Attribution and Why
Long gone are the days when it was acceptable to guess which half of your marketing was working.
Today, you have depth and variety of information, optimized funnels, automation, and personalization to track consumer behavior and to understand which digital marketing channel is responsible for the conversion rate. You have cross-device tracking, event tracking, user profiles, and integrated marketing stacks. You run machine learning and AI. You pay for analytics suites and multi-touch marketing attribution tools.
Yet all this technology and these best practices don’t always make your job easier. You still run into dead ends when trying to scale return on ad spend (ROAS). Often, your campaign optimization and budget allocation decisions still lack actionable customer journey analysis.
Can multi-touch attribution modeling solve these challenges? Can decisions become clear, even if it requires extensive work upfront? What concepts are important to understand first? Which multi-touch model is most viable? How do you decide if an attribution tool is a good fit for you?
This article will help you find clear answers to the questions above. We’ve rolled out attribution tools for large clients, cross-examined engineers who build them, compared the benefits of attribution to alternative marketing practices and tested the impact on ROAS. Read on to learn what we’ve learned.
Key Terms to Understand for Marketing Attribution
Before we dive deep into multi-touch attribution tools, let’s review a few foundational definitions.
Multi-Touch Attribution, Touchpoints, Conversion Values
Multi-touch attribution (MTA) is the practice of identifying a set of touchpoints that contribute to conversion and assigning a value to each of the touchpoints. By doing so, MTA helps you understand the combinations of touchpoints, and their chronological order needed to get customers to take the desired action. Multi-touch attribution and marketing attribution are distinct concepts, but the terms are often used interchangeably.
In tracking and reporting, customer interaction events and the customer journey are often what define the touchpoints. But it is important to note that a touchpoint doesn’t need to happen as an intentional action. An ad impression in a display campaign can also be a touchpoint.
Attributing value to a set of touchpoints leads to a better understanding of the customer journey or the path that leads to the desired outcome. It can also lead to a much better analysis of the marketing mix, including the offline channels. Insights stemming from such an analysis are typically used to optimize campaigns and to level up the return on ad spend (ROAS).
What Are Lookback Windows?
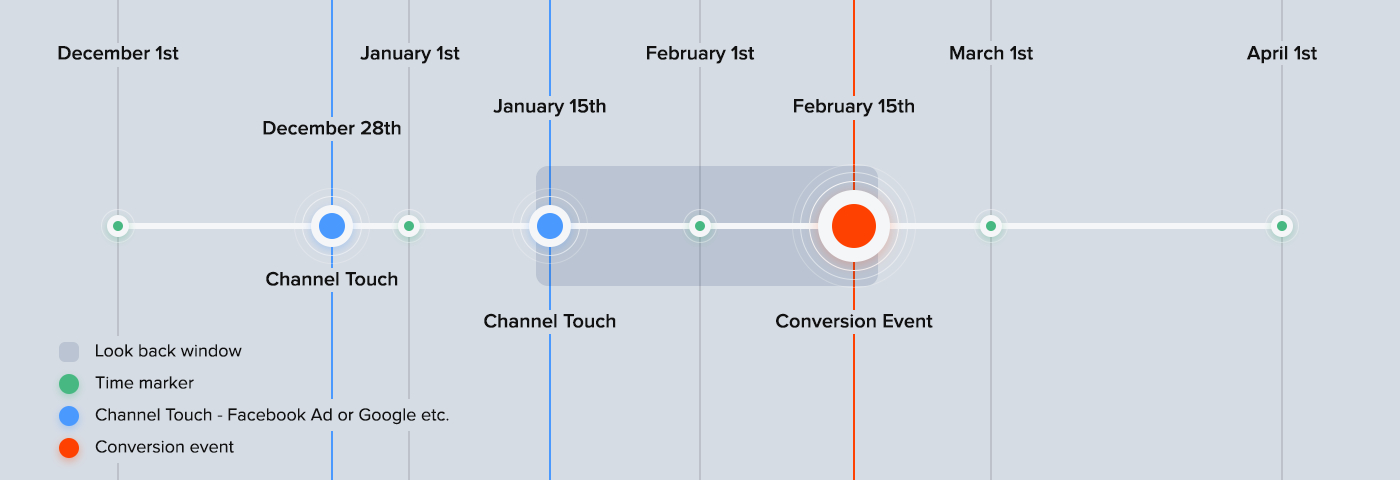
The lookback window is the period of time before the conversion that you are willing to credit.
The lookback window answers the question:
“Where did my leads, accumulated as of today, come from?”
If you’ve used Facebook Ads or Google Ads, the term will probably be familiar to you.
Most attribution tools (as reviewed in a section below) allow you to set the lookback window, but not all do. This is critical because the lookback window is one of the biggest factors in how the multi-touch attribution model will work. If a vendor limits the way you can do this compared to how their date picker works, it could be a recipe for disaster.
We worked on an attribution clean-up project where the client purchased the attribution tool on their own, could not figure it out, and brought us in to help. To keep the story simple, we wound up having to fire the vendor because they did not explain their model to the client before the purchase, and the model would not work with the client’s business model. It was sad because the sales rep painted a rosy picture made up of pure, 100% therapeutic-grade snake essential oil, and the product was a complete mismatch for our client’s business. We are hired by top brands to select and vet tools that are proven to drive revenue for their business model and get results.
It is very important to understand attribution models and their windows because this is where the sausage is made. It is critical to how you will report on your data.
What Are Look-Forward Windows?
When you build an attribution model, you need to look back in history to be able to tally the touchpoints and create a linear attribution model to distribute the credit of the conversion. Well, to make this even more fun, some attribution tools give you the ability to also take into consideration the revenues that have come in after the first conversion.
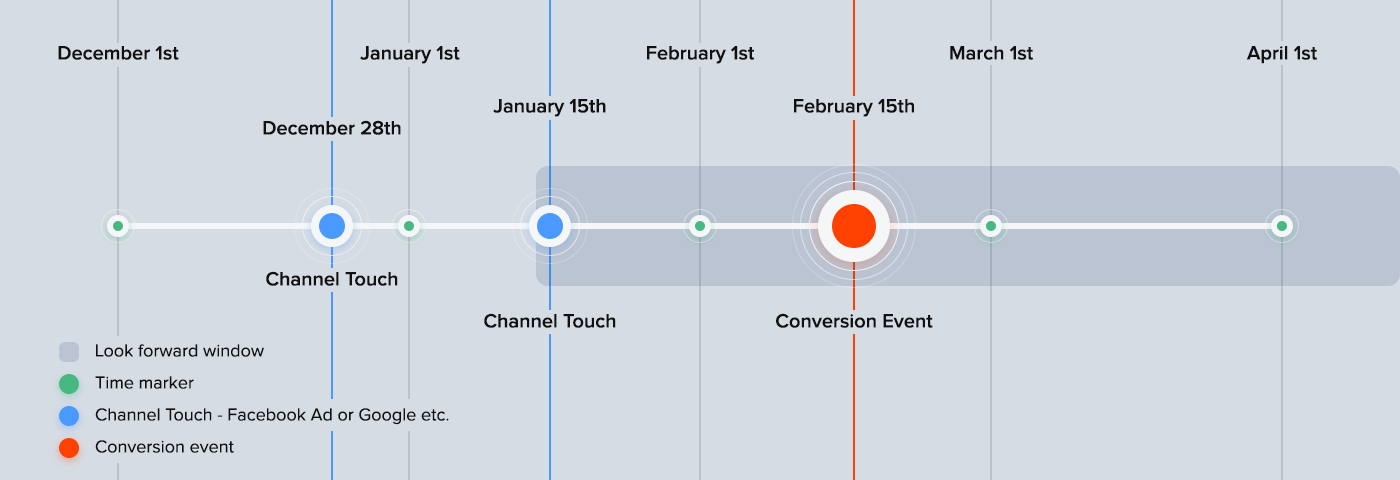
The look-forward window answers the question:
“What did I get for my spend?”
To put this into context, let’s say you are an eCommerce site or subscription business. You may spend $90 to acquire a customer when you know their first transaction with you is only going to be $25. Because you know your lifetime value (LTV) metrics and repeat purchase rate, you know it will take 4 months to become whole on your spend. Since your first transaction is only $25, your ROAS model in Google Ads and other tools appears to be upside down.
That said, any smart marketer knows you just use your average LTV multiplied by conversion amount to get your true ROAS.
The problem with that model is that not all advertising campaigns are average, and none of them have the same LTV. It is just the nature of the beast. While this makes it hard to track ROAS in some tools, companies like Attribution have a perpetual look-forward model that will take into consideration the LTV of a user. This model is a truly helpful differentiator for subscription businesses such as SaaS companies.
How Do UTM Parameters Work With Marketing Attribution?
Proper use of UTM parameters is essential to marketing attribution. UTMs enrich session attribution data in a way that helps you track the user across the multiple touches. Everything from Google properties to social media platforms. For the purpose of this article, we assume your knowledge of using UTMs is intermediate or higher. If you’re interested in additional resources related to UTMs or to get a tune-up on this concept, check out our popular UTM guide. For an effective way to streamline the UTM workflow of your team, check out the best UTM generation and automation tool out there, UTM.io.
What Are the Main Marketing Attribution Models?
Now that we have some basic definitions covered, let’s move on to the marketing attribution model. There are multiple ways you can structure your attribution models, and the one you choose will depend on factors such as your industry, content strategy, or funnel design. We’ll review some of the main attribution models out there, giving you the basic overview along with the pros and cons of each.
Here are the models you will actually be asked to choose between.
| Attribution Model | How Credit Is Assigned | Best Use Case | Main Weakness |
|---|---|---|---|
| First touch | 100% to the first touchpoint in the lookback window | Judging which channels create net-new demand | Ignores everything that closed the deal |
| Last touch | 100% to the final touchpoint before conversion | Short sales cycles and quick bid decisions | Overpays brand and retargeting, hides the funnel |
| Last non-direct click | 100% to the last touch that was not direct traffic | Cleaning up direct traffic inflation in legacy reports | Still single touch, just with one blind spot patched |
| Linear | Split evenly across every touchpoint | A first move off single-touch reporting | Treats a display impression like a demo request |
| Time decay | More credit the closer a touch sits to the conversion | Long consideration cycles with heavy nurture | Systematically underrates awareness channels |
| Position-based, also called U-shaped (40/20/40) | 40% first, 20% spread across the middle, 40% last | Teams that care about both demand creation and closing | The weights are a guess, not a measurement |
| W-shaped | 30% first touch, 30% lead creation, 30% opportunity creation, 10% to the rest | B2B funnels with defined lifecycle stages in the CRM | Requires clean stage timestamps, which most CRMs do not have |
| Full path | 22.5% each to first touch, lead creation, opportunity creation, and closed won, 10% to the rest | Long enterprise cycles where sales touches matter | Most complex to maintain, and the weights are still arbitrary |
| Data-driven (Shapley, Markov, Bayesian) | Algorithms weigh each touch by its measured contribution | High-volume accounts with clean conversion paths | Hard to explain to a CFO, needs a lot of data |
| Custom, built in your warehouse | Weights you define against your own revenue data | Historical reporting leadership will actually trust | Costs engineering time, and everyone argues over the weights |
First Touch Attribution Model

With the first touch attribution model, you attribute the cost and conversion to the source of the first visit that occurred within a lookback window. That’s essentially what we mean by the first touch, it means first interaction or contact. As a quick refresh, a look back window allows marketers to define a period of time before the conversion that you are willing to credit for the conversion.
The conversion can happen at any point during or after your selected lookback window. Importantly, it is very common to see conversions happen on a date that is outside the lookback window. Having the right lookback window is important to first touch attribution.
Last Touch Attribution Model

When looking at last touch attribution, it’s almost the opposite of the first touch model explained above, you attribute the cost and conversion to the source of the last visit in the lookback window right before the conversion event. What was the last click that results in the desired action in terms of touch attribution?
Without marketing attribution models in place, last touch attribution is usually the default way to assign conversions to touch attribution in ad platforms. Just like any model that attributes all conversion value to just one touchpoint, this model is often why marketers feel the need for more sophisticated attribution.
Linear Attribution Model

When using the Linear Attribution model, you attribute the cost and conversion equally to each visit in the look back window that subsequently resulted in a conversion.
Time Decay Attribution Models

When viewing the time decay attribution model, you attribute credit based on the number of days the visit was before the conversion.
For example, at McGaw.io, when talking about time decay we use this model :
y = 2^( -x / 7 )
The x is the number of days prior to the conversion that the referral happened. The 7 in the equation is the half-life, in days, and the base of 2 represents the halving itself. A touchpoint 7 days before a different touchpoint receives exactly half the credit. This represents time decay effectively.
The result is that the last touch attribution point will get the most credit and the first touch attribution will get the least credit.
Position-Based Attribution Models

This model was best known from Google Ads and similar keyword bidding platforms. It gives 40% credit to both the first touch attribution and the last touch attribution point, with the remaining 20% spread out across the other touchpoints on the user journey. One caveat for 2026: Google retired position-based, first click, linear, and time decay as native model choices in Google Ads and GA4 in 2023, leaving only data-driven and last click, so treat this as a generic model definition rather than a setting you can switch on in Google.
Data-Driven, Shapley, Bayesian, and Markov Attribution Models

Beyond the attribution models above, you can also tap into models that are more dynamic and flexible.
Data-driven attribution is now the default model in both GA4 and Google Ads, available to accounts of any size, not just large enterprise data sets. They use machine learning to give credit to touchpoints based on how impactful they were on the path to conversion. Data-driven models, as coined by Google, do not represent just one specific model. They’re applied on multi-channel funnels in a variety of ways, including the Shapley distribution model:
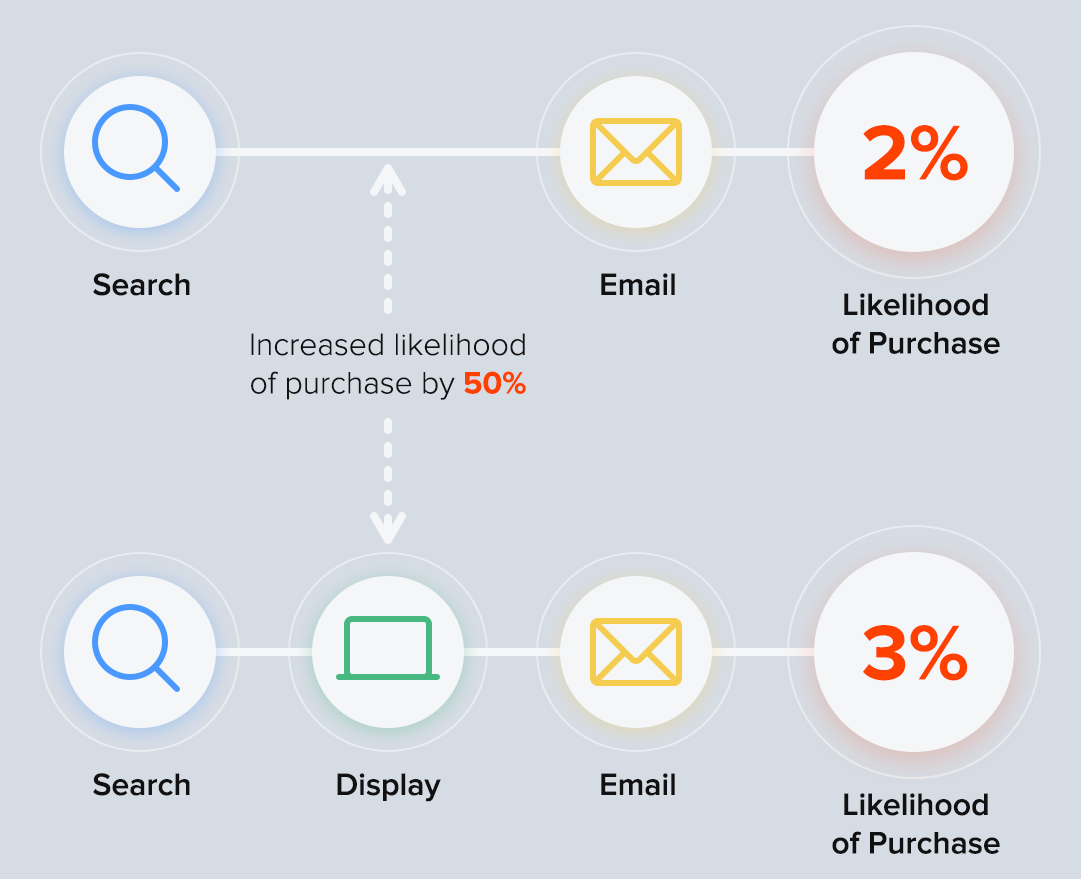
Shapley model illustration of attributing conversion value to a touchpoint based on the increased likelihood to purchase, as a result of adding that touchpoint.
A Bayesian model is a data-driven approach to attribution models used by vendors such as C3 Metrics. The concept is straightforward: by updating your initial beliefs with objective new information, you get a new and improved belief. The adaptive model doesn’t toss the existing equation for multi-touch attribution, it updates it when new patterns are identified.
The Markov model is an application of the Bayesian approach. (Interestingly, the lowest-cost tool on our list is the one that uses Markov prominently.) The approach looks at the touchpoints to conversions in chronological order and then simulates the impact of the removal of each touchpoint. Windsor.ai illustrates the Markov approach well:

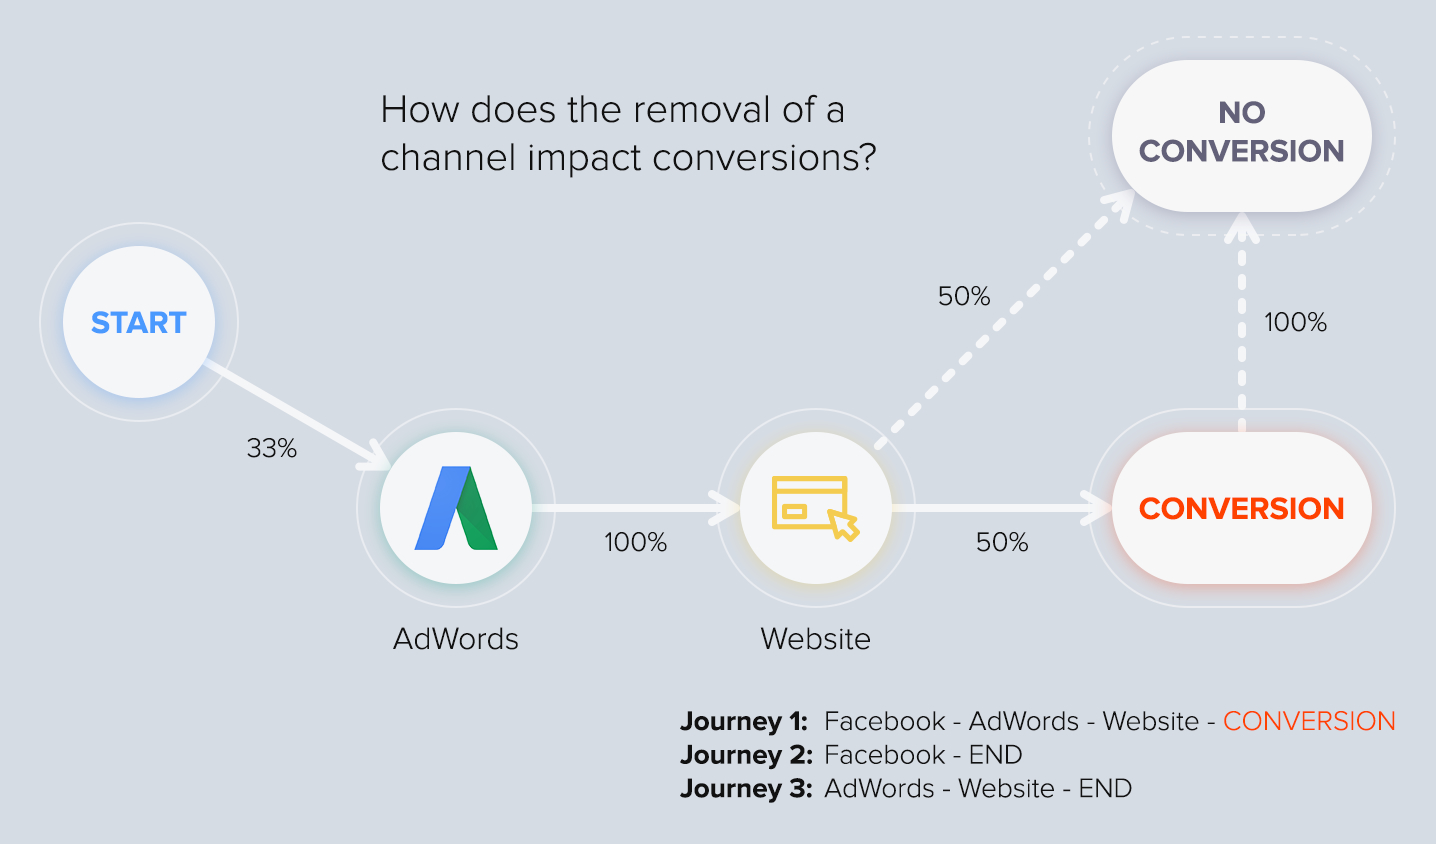
Simulation of the removal of a touchpoint in the Markov attribution model. Please note that the % numbers along the lines would now change, too.
How Much Value Am I Actually Getting from Multi-Touch Attribution?
The theory is great, but what does it mean in practice? How do you unpack the performance data to ensure you are getting value from multi-touch attribution?
Before implementation, you need to have a clear picture of your baseline data. In your industry, for this type of product or service, what are the norms in terms of multi-touch attribution? This is often related to factors such as the price and length of buying cycle. A company’s reputation and position in the market are other vital variants too, critical for being able to accurately analyze the value of multi-touch attribution and your performance.
Less expensive products or services will usually require fewer touches and less time before the prospect makes their buying decision. It’s less of an investment, they can allow themselves to be more impulsive and emotion led.
On the flipside, larger investments are likely to require more touches as you follow the prospect through the buying cycle. The goal is to make regular contact to educate, position your brand as experts and to build trust and brand recognition as they become ready to make a buying decision. Clearly this situation would require more touches.
Likewise, especially in B2B, budgeting is a major factor. Is this purchase likely to be something that’s budgeted for monthly or quarterly? Or is it the type of purchase that will need to be planned for in advance, and may not be budgeted for until quarter 3, for example.
How many stakeholders are needed to greenlight the purchase? The more complex and longer the buying cycle, the more touches will be required to nurture the relationship and to position you as the go-to company to work with.
Reputation and brand positioning go a long way. If you are a well known and well respected brand, you don’t need touches that help build that connection and trust with your prospect. It’s already been earned. You can and should expect fewer touches per conversion. The opposite is true if you don’t have that brand recognition or market share.
Being able to understand what the baselines are in terms of such data will allow you to analyze the data to understand your touch points and get value from implementing marketing attribution. Without the context, the data will be less significant.
How Do Custom Attribution Models Work?
When reading into the data-driven models, you may wonder if machine learning really is good enough to determine how impactful the individual touchpoints are. That question has been on our minds, too, and we’ve discussed it with clients. Machines are more objective than humans, but they lack common sense and they don’t always understand the full picture.
To reap the benefits of tailored weights for different touchpoints, you’ll want to consider building your own custom attribution model.
This is where things start to get really hairy, though. When building a custom model, the first issue you have is that everyone has an opinion on how the model should be built, and many times that opinion comes from a defensive standpoint when the model does not show the outcome they expected or hoped for. For example, maybe the model shows that a certain campaign wasn’t that effective in driving conversions. The person who advocated for spending on that campaign would likely argue that there’s a problem with the model, not their decision.
While custom attribution models are a normal thing, the big warning we have (one that is shared by all the vendors we spoke to) is that you should only be changing the model in the beginning and then try not to mess with it too much. Leaving the model alone will prevent people from creating self-fulfilling prophecies. This is super important.
You always need to use analytics to help guide your decisions. You’ll be throwing money down the drain if you use analytics to prove you’re right.
For an example of a custom attribution model, imagine a linear attribution approach to the model where you distribute the touchpoints over the journey of a customer and add weight to certain channels. The concept is fairly simple. The hard part may lie in deciding which touchpoints to include and what weights to assign to them.
Let’s take an example of direct mailers that are a huge driver of applications for a financial service. While this will be a channel that sends a lot of applications, it is just the starting point. Many people from direct mail come to the site and don’t fill out an application, so then they get slammed with retargeting and possibly Google Ads. To make sure the direct mail’s impact does not get lost in the shuffle compared to the digital ads, it should get a higher weight in the model compared to other channels (because it is what drove people to those other channels in the first place).
We’ve done a lot of work to decide that off-the-shelf attribution tools and their standard models are more for the optimization of your campaigns, and they are most likely to be used by the people who manage ad spend. Meanwhile, if you are looking for historical reporting, which should be used by the executive leadership team, rolling out your own custom model can be better and give you a much higher level of control.
Not sure which tool fits your stack? Build your stack.
Use Common Multi-Touch Attribution Models for Advertising Optimization Only
Attribution models are flawed in nature. They should be used for advertising optimization, not for historical reporting. The easiest way to think about attribution modeling is that it is directional, not definitive. If you go with a vendor compared to building your own model, you should be using it mainly to optimize your campaigns and not look back at information from three quarters ago.
If you want historical reporting, you should probably build your own model using your warehouse and tools like Looker (now part of Google Cloud).
Why and When Should You Build Your Own Attribution Model?
We feel attribution models should work by storing the cost with the individual user. The problem is that if a user does not convert and the lookback window is over, you need to redistribute the cost associated with that user to the other users who did convert. While this is not rocket science, it is difficult to create a foolproof system to manage the migration of those costs from user to user.
The way all of the attribution tools work is by looking at periods of time and then tallying the amount of money spent in that period, and also the number of conversions that happen inside that same window. Some vendors do provide an algorithmic approach to conversions to alleviate the time-period flaw, but it is still not perfect.
The key issue with looking at a time period is that if you look at June 1st to June 30th, you can see your total spend for that period. When looking at this same window, you are also able to see the conversions that happen in this period. Since most conversion windows can take 30+ days from the first touchpoint for a user to convert, most of the conversions for the time period of June 1st to June 30th will actually happen outside of that time window.
Simply put, you will mainly be looking at conversions from the spend in the period before this time period. Even with lookback windows and look-forward windows, you are misappropriating the spend to the conversion.
The ROAS number is flawed.
While bringing this up to many of the vendors, only one of them had a really good answer for it, and that was Nielsen. They were clear on the fact that you need to have the correct look-forward window and correct lookback window and only look at the attribution ROAS after your average conversion window would have closed.
So if your average conversion window is 45 days, then you cannot look at the ROAS for a period shorter than 45 days ago, because the data would not be accurate yet. The data should only be used for optimizing campaigns, and not historical reporting.
Building a custom attribution solution that uses your own data warehouse can be tailored to just the lookback and look-forward window you need for your specific campaigns.
Which Attribution Tools Are Best for Marketing Attribution?
Our research into and testing of marketing attribution tools was not quick and easy. Just like we did with the rest of this article, we put an amazing amount of effort into the vendor review section.
We had to get aggressive when demanding answers from vendors. We scared the crap out of some of the sales reps, and in all cases, we were escalated to the leadership team for accurate answers. We had multiple solutions engineers tell us they did not know, and they would need to get back to us with details. Many of them were not able to provide concrete documentation, and their workflow would not be able to stand the test of time with our team.
We’ve compiled the following list of attribution tools to consider. We encourage you to try the tools yourself, but we also understand it’s hard to do so with more than a few. Please use the reviews below as the next best thing.
Full disclosure: it is also important for us to state that we work with most of the vendors reviewed. When you talk to us and we help you sign with a vendor, we may get referral fees. At the time of this writing, the vendors listed below were willing to provide information, or are vendors we’ve chosen to work with for our own clients.
Start with the comparison, then read the individual reviews for the detail behind each row.
How to read this table. The vendor judgments here come from a hands-on review cycle run by the McGaw team, where we interviewed each vendor and ran their tools on client data. Product names, pricing, and status were re-verified in September 2026, but the feature-level assessments still reflect that original review. Treat this as a starting point for your own evaluation, not a current feature matrix. Where a product’s status has changed materially, we say so in its section below.
| Attribution Tool | Best Fit | Models Supported | Price Band | Main Trade-Off |
|---|---|---|---|---|
| Attribution | Subscription and eCommerce businesses, especially Shopify sellers | Data-driven, Shapley, Bayesian, Markov, random forest, custom | From $199/mo, custom above that | Look-forward windows keep past reports moving as new revenue lands |
| Adobe Marketo Measure (formerly Bizible) | B2B teams standardized on Salesforce and Marketo | Standard and custom B2B models | Not disclosed | Tied to the Adobe and Salesforce stack, support quality varies, and pricing is quote-only |
| Rockerbox | DTC and B2C brands with offline and TV spend | Custom models, interactive model editor, plus marketing mix modeling and incrementality | Not disclosed | Built for B2C, Salesforce integration is thin |
| C3 Metrics | Large ad budgets that need locked historical reporting | Bayesian, custom, machine learning | Not disclosed | Only pays off at serious spend levels |
| Windsor.ai | Lean teams that want cheap data blending into a BI tool or warehouse | Historically Markov chain, Bayesian, data-driven, and custom, but not currently documented | From $19/mo | Now sold as a data pipeline, and the attribution models we reviewed are no longer documented |
| Google Analytics 360 | Enterprises that need GA4 data limits, SLAs, and support | Last click, data-driven | Not disclosed | No custom models at any tier, so 360 buys you volume and support, not attribution control |
| Google Analytics 4 (free) | Teams that buy mostly through Google Ads | Last click, data-driven | Free | Weak outside the Google ecosystem, and non-Google cost data has to be fed in through Data Import |
Prices above are the vendor’s own published figures as of September 2026, or “Not disclosed” where the vendor only quotes on request. We do not estimate prices we cannot source. Confirm current pricing directly before you sign anything. If you want help running the selection, see our MarTech stack consulting work.
LeadsRx

Status, September 2026: do not buy this. Unbounce is shutting LeadsRx down on October 30, 2026. No new features are shipping, and customer access and data end on that date. We have left the review below for continuity and for anyone still exporting their data, but LeadsRx is not a candidate for new adoption.
Price point:
- Not disclosed, and moot now that the product is being discontinued
Pros:
- Interesting solution that enables you to generate ROAS numbers
- Aesthetically pleasing reports
- Feel-good platform focused on graphs
- Flexibility in attribution models types
- Robust feature set
Cons & considerations:
- Reporting designed more for the executive user or the marketer: Users who need graphs to feel good about a report
- Reporting lacks nitty-gritty data
- Poor support: Based on our experience
Attribution

Price point:
- $199/mo for the Shopify plan, from $399/mo for the Pro plan, custom above that
Pros:
- Simple dashboard
- Focus on showing your ROAS: Does not distract you with graphs made to look good more so than to help you make decisions
- The most native integrations out of the other vendors: And they can pull in cost from all kinds of places
- Some of the strongest integrations for conversions as well: They are one of the few vendors that have native Salesforce, Segment, and MetaRouter integrations
- Marketing attribution model suitable for subscription-based and e-commerce companies
- Presence of the P-value: This tells you the statistical significance of the model results. In other words, the P-value helps you avoid making a conclusion based on the dart hitting the dartboard when the dart is actually outside the last ring.
- Support for a broad variety of attribution models: Including data-driven, Shapley, Bayesian, Markov, random forest, and custom
- Data auditability, model auditability, and data exportability: The tool caters to these needs
- Ability to go down to the keyword level for Google Ads ROI attribution
Cons & considerations:
- Allows marketers to focus on look-forward windows: Custom lookback windows are available, but the tool’s focus on look-forward windows is prevalent and may be hard to work with for some marketing teams. We think look-forward windows are important because the logic behind them is sound. But look-forward windows will be something you need to consider carefully before you commit, because they may not be ideal for lead generation
- Lifetime value (LTV): The look-forward window aggregates all revenue from after the period you are looking at. While this gives you LTV on your spend and gives LTV in the ROAS, it also makes it so your reports are constantly changing. If you look back to January in the month of March, it will show one number, and then if you look again in April you would see a new, higher number because more revenue for those users would have come in.
Adobe Marketo Measure (Formerly Bizible)
Naming update: Bizible was acquired by Marketo, then absorbed into Adobe. The product now ships as Adobe Marketo Measure. The review below reflects our direct experience with the team and the product through the transition.

Pros and price point:
This space intentionally left blank.
Cons & considerations:
- Marketo acquisition, then Adobe acquisition: Much of the team that knows what is going on has left. They are having a tough time getting integrated into the multiple mergers.
- Adobe Experience Cloud lock-in: It now ships only as part of the Adobe stack, so best-of-breed buyers are paying for a suite they do not want.
- Horror stories of no support, no customer success, and more from our friends who use them.
- Data typically based on Marketo and Salesforce: This is not bad, but often not a good fit
Nielsen (Formerly Visual IQ)

A note on naming: this tool used to be called Visual IQ. Nielsen acquired it in 2017 and folded it in. Status, September 2026: confirm before you buy. Nielsen sold its marketing mix modeling business to Circana in 2024, and the attribution product page we used to link to is gone. Nielsen no longer clearly sells a standalone multi-touch attribution product. The review below reflects our original hands-on evaluation and is kept for reference. If you want Nielsen for offline and TV measurement, ask them directly what still exists before you start a procurement process.
Price point:
- Not disclosed, enterprise quote only
Pros:
- Marketing mix modeling: strong at the time we reviewed, but this is the business Nielsen sold to Circana in 2024
- Willingness to talk about the entire attribution space: And where they felt the flaws were
- TV attribution: As you’d expect of a Nielsen company
- Sales teams tend to enjoy this marketing attribution tool
Cons:
- Rigid support: One of the more rigid vendors in the mix in general
- Lack of key integrations: The tool allows marketers to integrate marketing channels but not with customer data platform (CDP) or customer data infrastructure (CDI) tools such as Segment
- Traditional marketing stack: Used by marketers who rely predominantly on the traditional marketing stack, e.g. Adobe or Tableau. We prefer CDPs and CDIs.
Rockerbox

Price point:
- Not disclosed, demo and quote only
Status, September 2026: Rockerbox has broadened well beyond the multi-touch tool we reviewed. It now packages multi-touch attribution, marketing mix modeling, and incrementality testing on a first-party data foundation, so it competes on all three of the methods we compare later in this guide rather than just the first.
Pros:
- Cool UI for a marketing attribution tool: They provide some advanced features when it comes to segmenting revenue
- B2C space: This tool is built for B2C
- Impressions tracking
- Great team to work with
- Honest communication about custom models: The team clearly conveyed that if you want to dive deep into custom models, you aren’t going to want something pre-packaged and out of the box. They seemed forthcoming about providing tools to make customizations, instead of trying to convince you to use a solution that already exists in their tool.
- Honest communication about the flaws of marketing attribution: The team was very clear that attribution itself is flawed and that companies need to use multi-touch models to be directional and optimize. The models aren’t meant to tell you the secrets of your customers and their journey.
- Ability to track everything: Even TV
- Cohorting of revenue and LTV tracking
- High level of granularity and accuracy in ROAS: Thanks to the customization of how ad data and link data are collected
- Interactive model editor: You can make changes without asking for support help
Cons & considerations:
- Customization of ad and link data collection: This necessary workflow can be hard to maintain
- B2B: The tool is not perfectly equipped to work with B2B companies right now. We are unsure if they will expand to the B2B market, either.
- Salesforce integration: This is lacking and may not be built anytime soon
- Customization fees: If you don’t have your own team with the expertise to customize the models, their help comes with a steep fee
C3 Metrics

Price point:
- Not disclosed, demo and assessment only
Pros:
- Great communication
- Experienced team: One of the early players in this market
- Custom models
- Machine learning: Helpful when refining the models
- Custom requests: They have the ability to accomplish other custom requests
- Bayesian model: We appreciate the use of advanced and less common attribution models
- Locking the look-forward period window: The ability to do this makes it so that the numbers will not change if you look back in time
- Good integrations with advertising networks: Better than most vendors
- CDPs: The tool integrates well with CDP’s
Cons & considerations:
- Cost: The investment only pays off for truly large ad spends, sometimes only after counting in offline media such as direct mail or TV ads
Windsor.ai

Status, September 2026: the product moved. Windsor.ai now sells itself as a no-code data pipeline connecting 350+ sources to BI tools and warehouses. Attribution modeling is not named on its homepage, its pricing page, or its documentation index. The review below still describes what we tested, but check that the models you want still exist before you buy it as an attribution tool.
Price point:
- From $19/mo billed annually on Basic, rising through $99, $249, and $499/mo as you add connectors
Pros:
- Bayesian model, Markov chain: We appreciate the use of advanced and less common attribution models
- Lightweight tool: There is little additional tagging or tracking required
- CRM integration and data-driven models: This helps track offline activity
- Integration of costs: You can pull in data through API or email/SFTP for channels such as TV or radio
- Custom attribution models: The team has the ability to create them for you
Cons:
- Product still evolving
- Less polished user experience
- Attribution is no longer the headline product: the Markov, Shapley, and Bayesian modeling we liked is absent from the current pricing page and documentation index, so treat it as something to confirm in a demo rather than assume
- You are buying plumbing, not analysis: it moves data into your BI tool or warehouse well, but the modeling and the interpretation stay your team’s job
- Connector limits drive the price: the entry plan covers three data sources, and a realistic ad stack pushes you up the tiers fast
- Refresh and history are tiered: daily syncs and short data retention on the cheap plans, with hourly syncs and multi-year history only higher up
Google Analytics 360 Attribution
Update for 2026: Universal Analytics is gone, and this review now applies to the Analytics 360 tier of Google Analytics 4. The biggest change since we first published this section is that data-driven attribution is no longer a 360-only feature. Every GA4 property gets it, free tier included.

Price point: Not disclosed, sales contact only
Pros:
- Easy setup: Minimal additional tagging required
- Native integrations: Google Analytics, Google Ads, and Search Ads 360
- Last click and data-driven attribution models: Google retired first click, linear, time decay, and position-based models across Google Ads and GA4 in 2023, so these two are what remain
- Offline conversion import through Google Ads and BigQuery
- Intuitive use, marketing attribution made easy
- BigQuery export without the free tier’s ceilings: every GA4 property can export to BigQuery now, but standard properties cap at 1 million events per day, and fresh daily export is 360 only
Cons:
- No custom attribution models: GA4 dropped them entirely, at every tier including 360
- Acquisition lookback window caps at 90 days, so anything with a longer sales cycle is invisible to the model
- Tracking outside of Google ecosystem: This need can be difficult to configure
- Limited export or access to raw data outside of BigQuery
- ROAS calculations limited
- Support not great
Google Analytics 4 Attribution (Free)
The standalone Google Attribution beta this section originally covered was retired. Its capability moved into the Advertising section of standard GA4 properties, so the notes below now describe the free GA4 attribution reports.

Price point:
- Free
Pros:
- Powerful free attribution platform
- Additional tagging not required
- Built into Google Analytics (GA)
- Native integration with Google Ads, Google Analytics, and Search Ads 360
- Data-driven/machine-learning based attribution
- Touchpoints tracked within the acquisition lookback window, which caps at 90 days
- Intuitive to use
- Easy way to start with marketing attribution
- Great solution for small businesses: Good fit if you use GA and are just getting started with attribution
Cons:
- Free version limited to Google advertising
- Non-Google cost data needs Data Import: a manual CSV or Sheets upload, or an automated SFTP, S3, GCS, BigQuery, or Snowflake feed, and the join only works if utm_source and utm_medium match exactly
- Offline attribution: Possible but awkward. Offline events import through Data Import as CSV, capped at 10 event data sources and a window of the previous two days plus today, so it is not a substitute for a real offline pipeline
- Raw data export: Available through BigQuery on the free tier, but capped at 1 million events per day, and you pay BigQuery storage and query costs beyond the sandbox
- ROAS calculation: Not present
- Custom attribution model: Not present
- Limited support: Only in community forums
How Do You Pick the Right Attribution Tool?
Your approach to the tools is more important than the tools themselves. Also, this space is still really young. When talking to the vendors, they all admitted that the way date ranges in the model work, relating the time period of ad spend vs. conversion completion, leaves a lot of room for error. As with most analytics tools and MarTech mistakes, the difference between directional and definitive is the key thing here.
It is important to re-emphasize that all of the tools above will be best used for the optimization of paid channels. The only tool we felt which would also help with historical reporting of the ad spend would be C3 Metrics.
For some of our larger clients, attribution vendors would not provide what they’re looking for, because they want something more custom. The alternative is to build your own model on top of a data warehouse and a customer data platform. This can cater well to continuous changes in attribution best practice.
Does Marketing Attribution Still Work Without Third-Party Cookies?
Yes, and the reason changed in 2025. Google announced on April 22, 2025 that it would not remove third-party cookies from Chrome after all, and on October 17, 2025 it announced it would retire most Privacy Sandbox APIs, including Topics, Protected Audience, and the Attribution Reporting API. No sunset date was given, and several are still in Chrome today. Only a few pieces survive: CHIPS, FedCM, and Private State Tokens.
So Chrome kept cookies. Safari, Firefox, and Brave did not.
Those browsers still block or partition third-party cookies by default, and Apple’s App Tracking Transparency still limits mobile advertising identifiers. Signal loss is real. It is just uneven, and it varies by browser and device instead of arriving on one deadline.
That changes what you build. Four things carry the weight now:
- First-party data collection through a CDP, governed by a naming standard your whole team follows. Start with our guide to building a tracking plan that scales.
- Server-side tagging, so conversion events leave your server instead of the visitor’s browser, where ad blockers and browser defaults strip them.
- Identity resolution, so the same person on a phone, a laptop, and a work email does not look like three different prospects. Here is how to build a single customer view.
- Consent mode and data clean rooms, so you keep modeled conversions and privacy-safe ad platform joins when a visitor declines tracking.
Get these right and every model above works better. Skip them and no attribution tool will save you.
Multi-Touch Attribution vs. Marketing Mix Modeling vs. Incrementality Testing
Multi-touch attribution is one of three measurement approaches most teams end up running, and it is the one that works at the level of an individual user journey. Marketing mix modeling uses aggregate spend and outcome data over time. Incrementality testing withholds spend from a matched group and measures the gap.
| Method | What It Measures | Data It Needs | Answers Best | Where It Breaks |
|---|---|---|---|---|
| Multi-touch attribution | Credit per touchpoint in a user journey | User-level tracking, UTMs, conversion events | Which campaign or keyword to scale this week | Channels it cannot track, and time-period mismatch between spend and conversion |
| Marketing mix modeling | Channel contribution to revenue over time | Aggregate weekly spend, revenue, and external factors | How to split next quarter’s budget across channels | Needs years of history, and it cannot tell you which ad to pause today |
| Incrementality testing | Conversions that would not have happened otherwise | A holdout group and enough volume for significance | Whether a channel is worth funding at all | Costs real revenue to run, and small accounts never reach significance |
Marketing mix modeling used to mean a six-figure agency retainer. Open source killed the license fee, not the headcount. You still need someone who can defend a Bayesian prior to your CFO. Google released Meridian in 2025 and Meta has maintained Robyn since 2021. Both are open source, and both put modeling within reach of a competent data team.
Sequence it like this. Multi-touch attribution optimizes campaigns week to week. Marketing mix modeling sets budget across channels each quarter. Incrementality tests settle the arguments the other two start. If your team lacks the engineering support to stand any of this up, read how to build a marketing attribution stack without waiting in a dev queue.
What Are the Alternatives to Marketing Attribution?
We highly recommend listening to Manbir Sodhia, VP of Growth at Oura and Dan McGaw’s discussion on “The Stack Podcast” on optimizing DTC ROAS. The thoughts we found to be the most constructive were the ones about tactics that sit outside the three methods above. We covered lift and incrementality testing in the last section, so here is what is left:
- Customer journey mapping
- Journey analytics
- Self-reported attribution, asking buyers at the point of conversion how they found you
The common theme is that if you’re getting lost in first touch or last touch modeling, relying on marketing attribution modeling may not be a good fit for you, and you could possibly get better results by:
- Setting a specific goal
- Working toward the goal by applying insights and tactics that are under your full control
We are big believers in the value of marketing attribution. We also believe there is no one size fits all solution. The goal is to find the solution that fits your needs, budget, and resources, and ultimately delivers the best ROI.
Marketing Attribution FAQ
Conclusion: Do Multi-Touch Attribution with a Wide Open Mind and Full Buy-in, or Don’t Do It At All
We’ve seen cases where a marketing leader refused to believe the marketing attribution model even though the data was correct. This can be a huge issue in some marketing attribution projects. If you have the expectation that marketing attribution is going to prove you right, and it proves you wrong, you’ll find yourself blaming the model and not the campaigns. This can easily lead to losing the buy-in of you and your team.
Another common scenario for a very sophisticated attribution implementation to go sideways is being blocked by developers over and over again. Not having a full commitment to the complex project can quickly lead to wasted money, time, and opportunity. They go hand-in-hand.
Ryan Koonce, the executive chairman of Attribution, observed yet another tendency:
What we have seen is that media buyers (usually agencies) who compare to GA or Facebook Insights are frustrated with MTA because they can only count the conversion once, and their net numbers, therefore, don’t look as good. Internal media buyers, on the other hand, who are not incentivized to increase spend, but rather optimize ROAS, tend to get a lot of value from MTA.
What you will get as an outcome is never what you expected, and that is the point.
Even when the ingredients are imperfect and you don’t have a complete picture, you can still do a ton with that extracted information. You can, for instance, gain a profound understanding of the customer journey, and use the insight to set up effective personalization.
With that said, marketing attribution is a lot like product analytics and product management. When building a product, you often create a feature to be used in a certain way, and then your users use the feature differently than you ever anticipated.
It helps you understand the customer journey. It can tell you where your customers truly came from, what their pain points are, what their experience is throughout the steps, what the role of the product or offer is in the journey, and what the conversion factors are beyond your current campaigns.
This is why you want to use analytics to tell you what is happening, not confirm what you thought would happen.
About the author. Dan McGaw is the CEO of McGaw.io, a MarTech and analytics consultancy and the first Segment Solution Partner. McGaw holds a seat on the Twilio Partner Advisory Board in North America and EMEA. Dan wrote the growth playbook Build Cool Sh*t and ran marketing at Kissmetrics before founding McGaw. His team has run more than 500 Segment implementations and the customer data platform work around them. Those rollouts, plus the vendor interviews quoted above, are where this guide comes from.
Improve your ROAS by understanding the value of your individual touchpoints along the customer journey. Schedule your free consultation and let’s get started.


Dan,
Thanks for writing this. Is it safe to assume all this attribution works in B2C where it’s form submissions and ecom purchases?
I ask because due to cross-device fragmentation and phone call attribution, it is next to impossible to track attribution.
For example:
1. John sees a display ad on mobile on the subway.
2. John comes home, logs on to his home computer, Google’s brand name
3. From the desktop, he visits brand website from the first search result on Google (likely organic)
4. Sees the “Organic” phone number provided by call tracking app, and calls the brand
In all above attribution models, all we’ve seen is this lead gets attributed to an Organic Google search.
However, the actual credit needs to go to the Display campaign.
So yes, attribution is trackable in:
– SaaS (trial signup)
– Ecommerce (purchase events)
– Form submissions
But not in service based phone calls.
thank you for writing about attribution. This has been, and will continue to be, a key topic and challenge for marketers I enjoy every article and conversation on the subject. I believe marketing analytics is one of the most important and not only its important but it also helps in understanding the hidden and potential areas.Good write up