
There are many ways to look at Conversion Rate Optimization (CRO), but the end goal for all companies is to have a kick-ass site that converts users of all types that come through all different channels. To do this, you need to focus on three key areas of CRO.
The three areas to focus on when coming up with a CRO strategy are:
- Data: Data sucks if it’s not integrated; what’s your stack?
- Insights: What is your data telling you?
- Site Design: Test design iterations based on data, user feedback, and insights.

1. Data: Data sucks if it’s not integrated; what’s your stack?

Any good data strategy comes from knowing the key systems and players in that strategy. Not all systems play well together, and some are better at understanding user behaviours than others. This section will walk through a few different systems and the pros and cons for each.
All websites are different, so some systems might work better for a particular business than others. Keep the end goal in mind to better understand what channels, content, and user events are driving the most sales or conversions on your site. Once you understand your end goals, you can begin to see which systems are going to work to your advantage in building a data strategy that rocks.
Analytics Systems to Consider
All data has to have a hub, which is usually built around a web or mobile app analytics system that ties all user interactions into one place—a place that can be built out to understand funnels, conversions, revenue, and costs. Below we go through some of the main systems we use to help our clients.
Kissmetrics:
Built into a CRO strategy, Kissmetrics helps analysts and everyday users build data and funnels to better understand what’s driving growth. It does this through specific dimensions and metrics that are designed to help Kissmetrics users understand how site or mobile users are getting through the funnel.
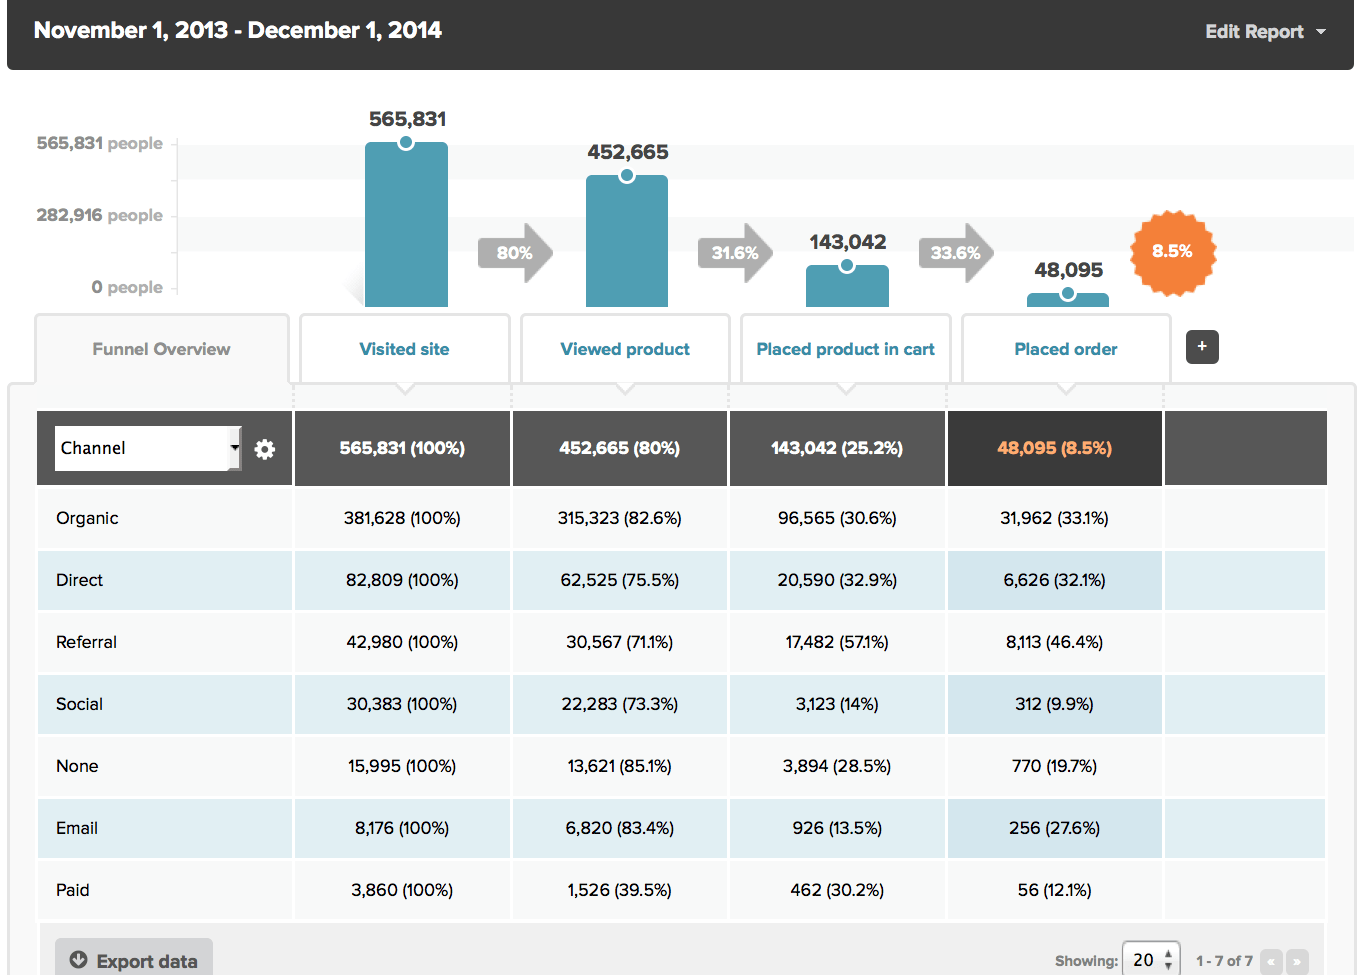
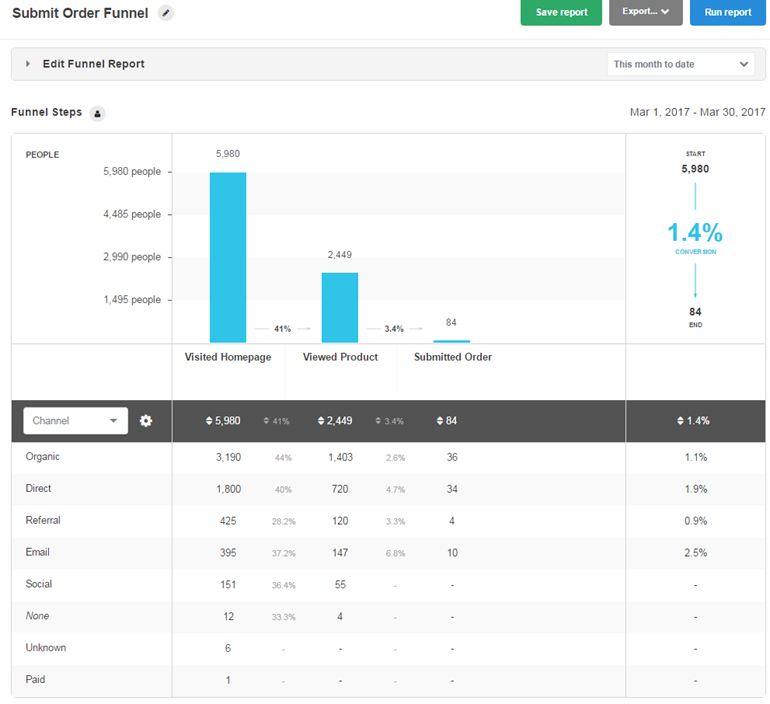
As shown in the image above, the system does really well at identifying funnel attributes based on where a user came from and what they did while they were on the site, and it can show how much revenue each channel, landing page, and user type is driving.
Kissmetrics also plays nice when integrating with the many other systems that need to be utilized in a CRO Strategy. For instance, shown below is an integration directly with Mailchimp, an option that is not currently available in systems like Google Analytics or Adobe Analytics:
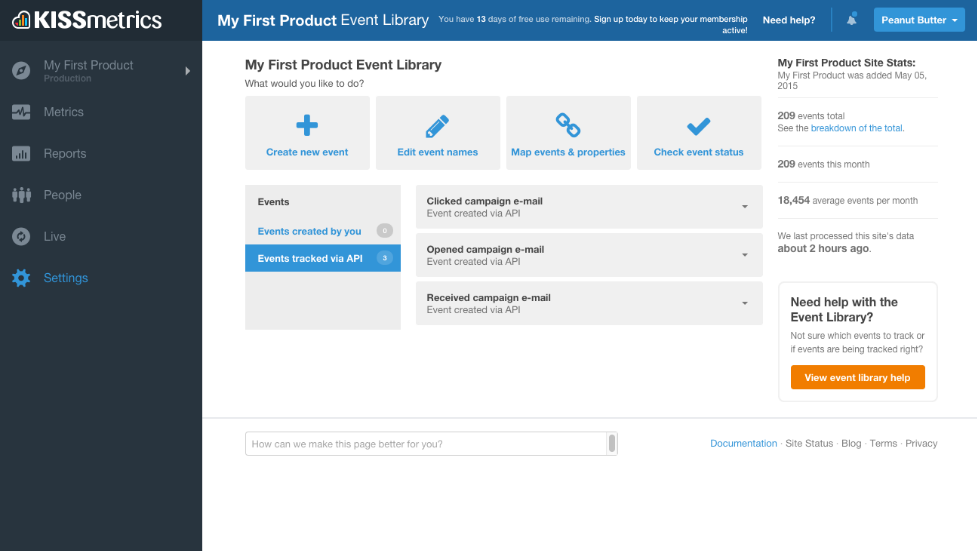
This type of integration makes it so that all of your email data will always come through bucketed correctly, instead of going into the deep, dark abyss known as direct traffic, which turns data users into zombies who think direct traffic is amazing!

Don’t become a data zombie! Direct traffic is not your friend!
Implementing Kissmetrics is about the same as any other analytics tool. You’ll need to know what steps of the funnel or events you want to tag, how those tags can be implemented based on your access to the site, and if those tags need custom variables that need to be built through a custom javascript code or if they are standard.
Kissmetrics offers to do their own implementation on your site for an up-front cost of $1,500, which may be a good option for those trying to do this on their own. Kissmetrics can also be implemented through Google Tag Manager or Segment.
You can also have a professional agency handle implementation for you. McGaw.io specializes in implementing Kissmetrics, so reach out to us if you’d like to get started with this system.
A/B Testing and Kissmetrics: Buyer Personas

One of the biggest reasons to use Kissmetrics is to build out specific buyer personas for your site. Buyer personas are the characteristics and demographics of those users who actually buy content, goods, or services on your site.
Kissmetrics cites the following information you need to come up with in order to fully build out a buyer persona:
- Search terms used to find you
- Content they view, search for, or download on your site
- Heat maps (what is drawing their attention)
- Search terms used on your site
- Feedback from your sales department about customer details
- Customer surveys
- Customer feedback
- Contact database
- Market research and segmentation
- Social media (Facebook Insights and Twitter Analytics, for example)
- Competitor data (SimilarWeb can provide details)
- Analytics (language, location, device, behavior, interests, etc.)
Kissmetrics excels at analytics, the last item on the list. How are users coming to your site? What are the behaviors that are driving the most sales when they get to your site? See what Kissmetrics says about building a Buyer Persona Map.
You’ll also want to check out this article, shared by Kissmetrics but written by Hubspot, to see a list of 20 questions to ask when creating buyer personas.
Mixpanel:
Mixpanel boasts that they are amazing at driving understanding for product analytics and helping analysts understand a user’s journey.
Mixpanel is used by many CRO experts to better understand the impact of mobile and desktop interactions in the user journey, and it can integrate its data directly with the marketing platform you use. Below is a list of the system’s unique integrations and options:
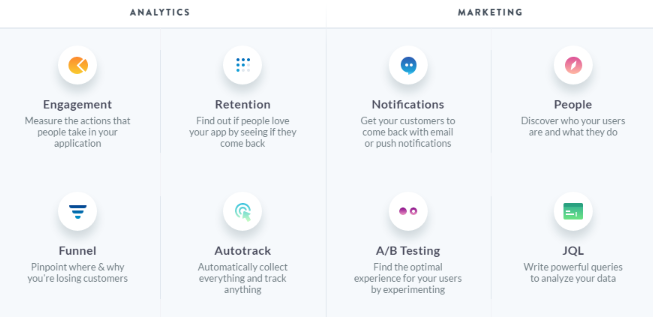
As shown above, Mixpanel does a great job of offering insights in engagement and funnel analysis, but it also has a marketing arm that drives these user interactions and focuses on a user as a person coming to your site. This is where most analytics systems fall short, since they don’t have a full suite of services for marketing and analytics that are focused on mobile and desktop users.
Mixpanel also has a unique predictive model that will help you identify users based on behavior. These behavior events can be based on any type of user engagement or event you add into Mixpanel as a predictor. See below for an example of the system:
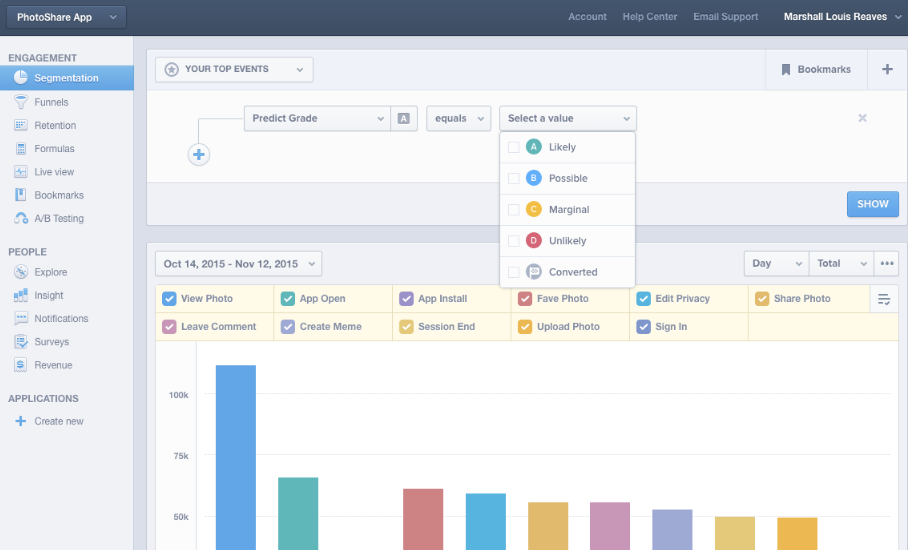
Mixpanel’s system works really well for apps, which is one of their primary focuses. App notifications are easy to set up and build out in the Mixpanel system, as is deploying tags inside an SDK.
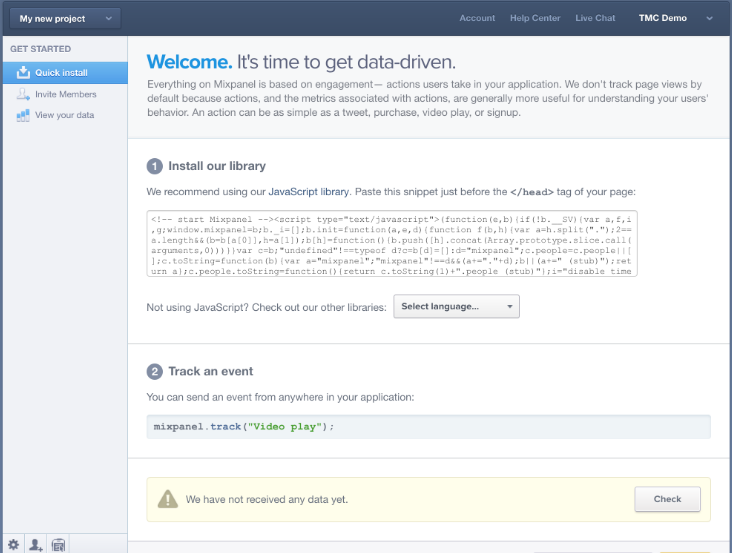
Once the code is installed and events are firing, it’s easy to set up specific funnels for user interactions. These should be based on the different steps it takes for a user to checkout or convert on your site or app.
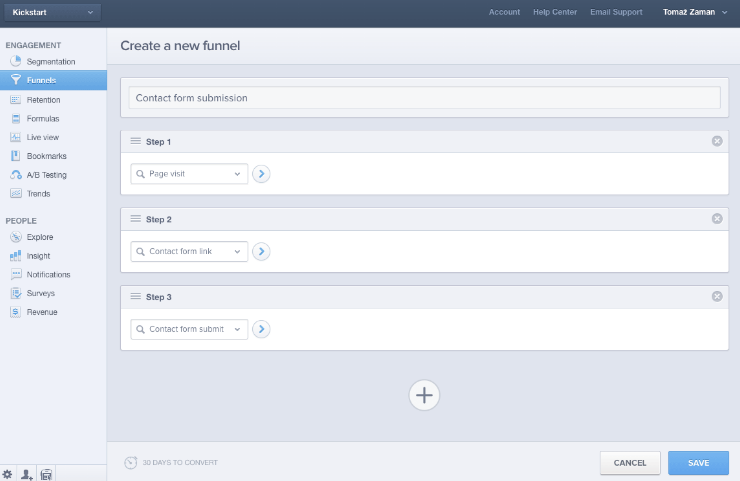
Mixpanel also integrates well with Mailchimp, Salesforce, and other marketing systems, but this is usually done by using a tag/data manager like Segment.
Mixpanel and A/B Testing
Mixpanel makes it easy to A/B test, especially on an app where changes on the backend will automatically be shown on a device (shown below).
(Change the copy on a page with the A/B testing tool)
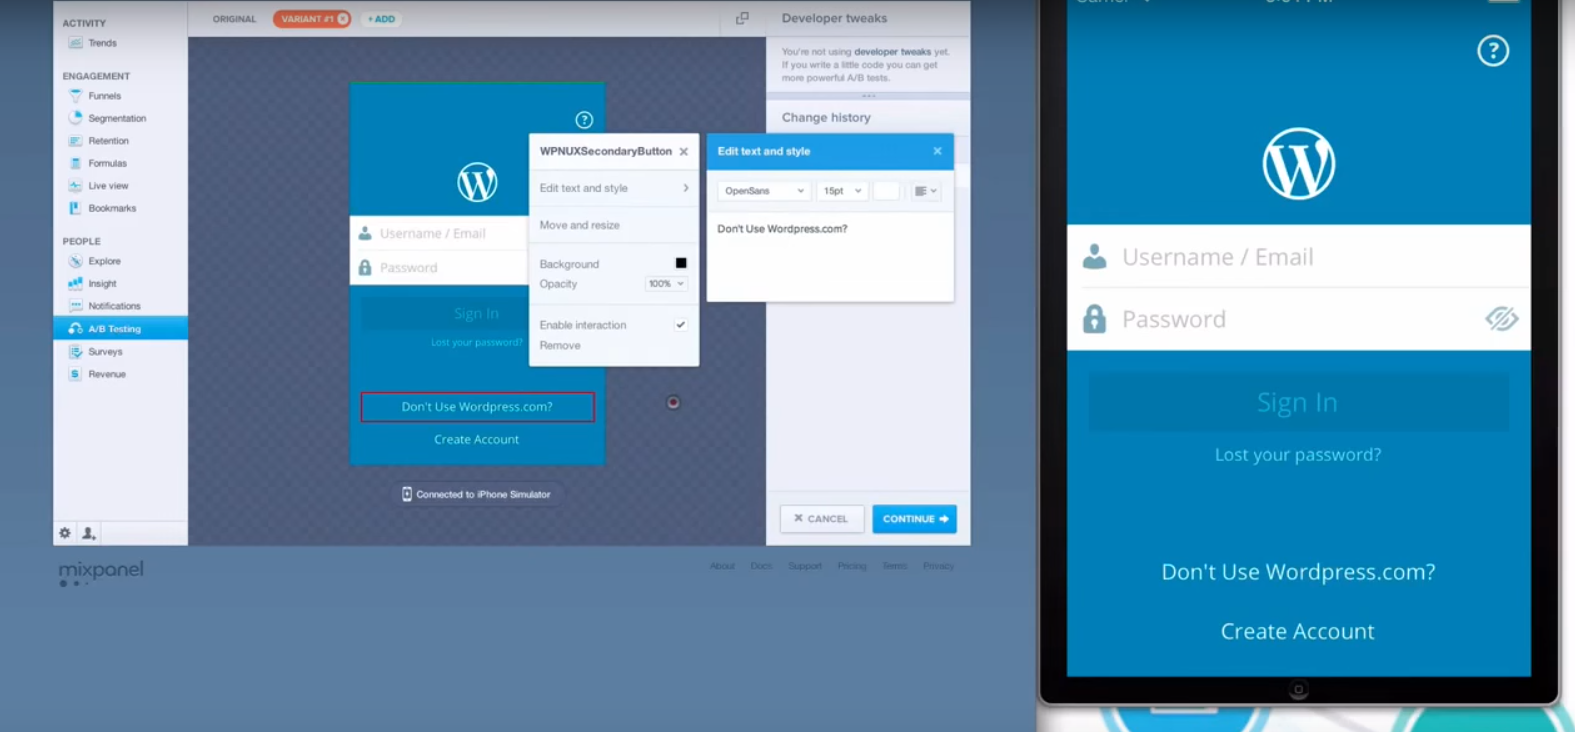
(Change the logo location using the A/B testing tool)
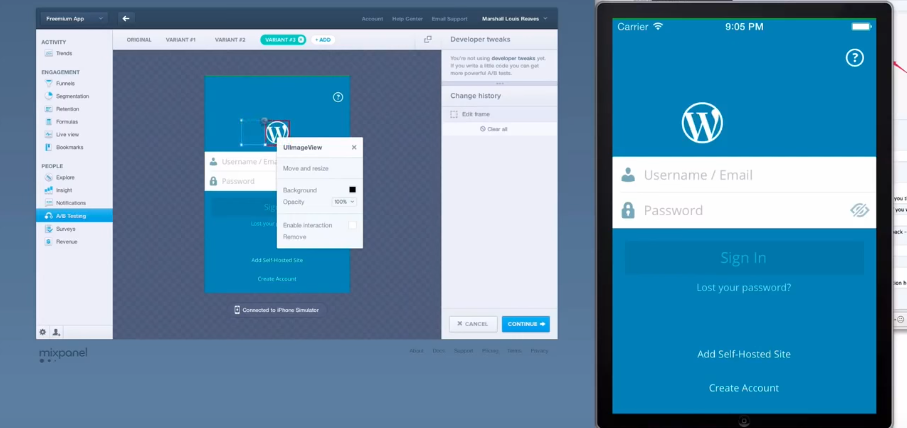
It’s also easy to segment all data down to the specific users (think buyer personas) to see how each experiment affects a specific user type. See screenshot below:
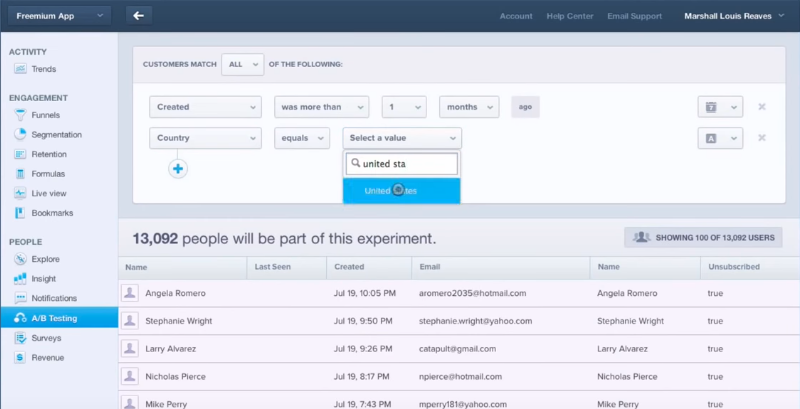
Each variation can have a specific goal that it uses in order to say whether the variation is successful in beating the baseline metric:
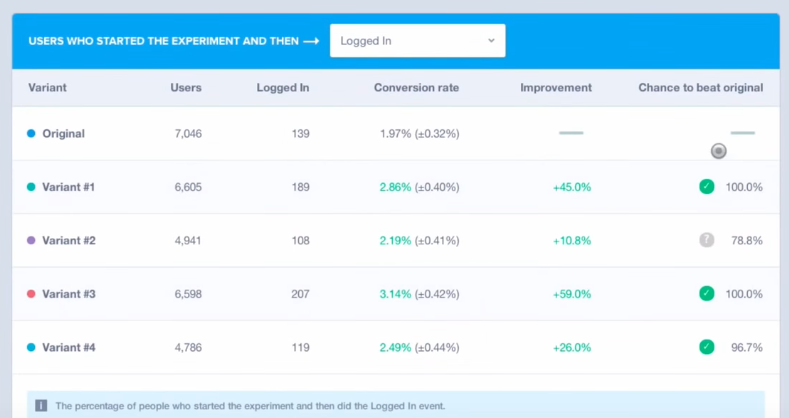
For a full explanation of the benefits of using Mixpanel for A/B testing, check out this video.
The McGaw.io analytics team can help you get further into Mixpanel and understand if this system would be a good option for you. Most likely, if you have an app, the system will be able to help you drive sales in a way no other system can. Contact us to learn more about our Mixpanel and app services.
Amplitude
CRO experts and analysts alike may not know this system as well as the others, but Amplitude boasts some enhanced analytics for products and web that need to be discussed when we’re focusing on building out a data strategy.
The system has the following characteristics that help us as marketers, analysts, and CRO experts understand the best actions that users take.

Real-time analytics is great, but not something I use as a marketer very often. What I want to see are specific user behaviors that are going to make my company or client money. So diving deeper into the User Behavior Insights feature, we can see that Amplitude helps you customize any user path to see which one is working the best overall. They actually came out with a specific data-mining tool that helps you understand how to retain users on your app, specifically what activity is going to be the most predictive in driving retention for new users.
Keep in mind, an average app loses about 77% of its users in the first 3 days after install!

Amplitude and Compass
Compass was built to give marketers the understanding they need to help define the most important activities a user needs to take in order to build retention into the app and stop the bleeding of new users who drop off and never come back.
For instance, Quizup began using Compass on their app and found that users who have a social connection in the first 7 days have a 60% higher retention rate… 60%!!!

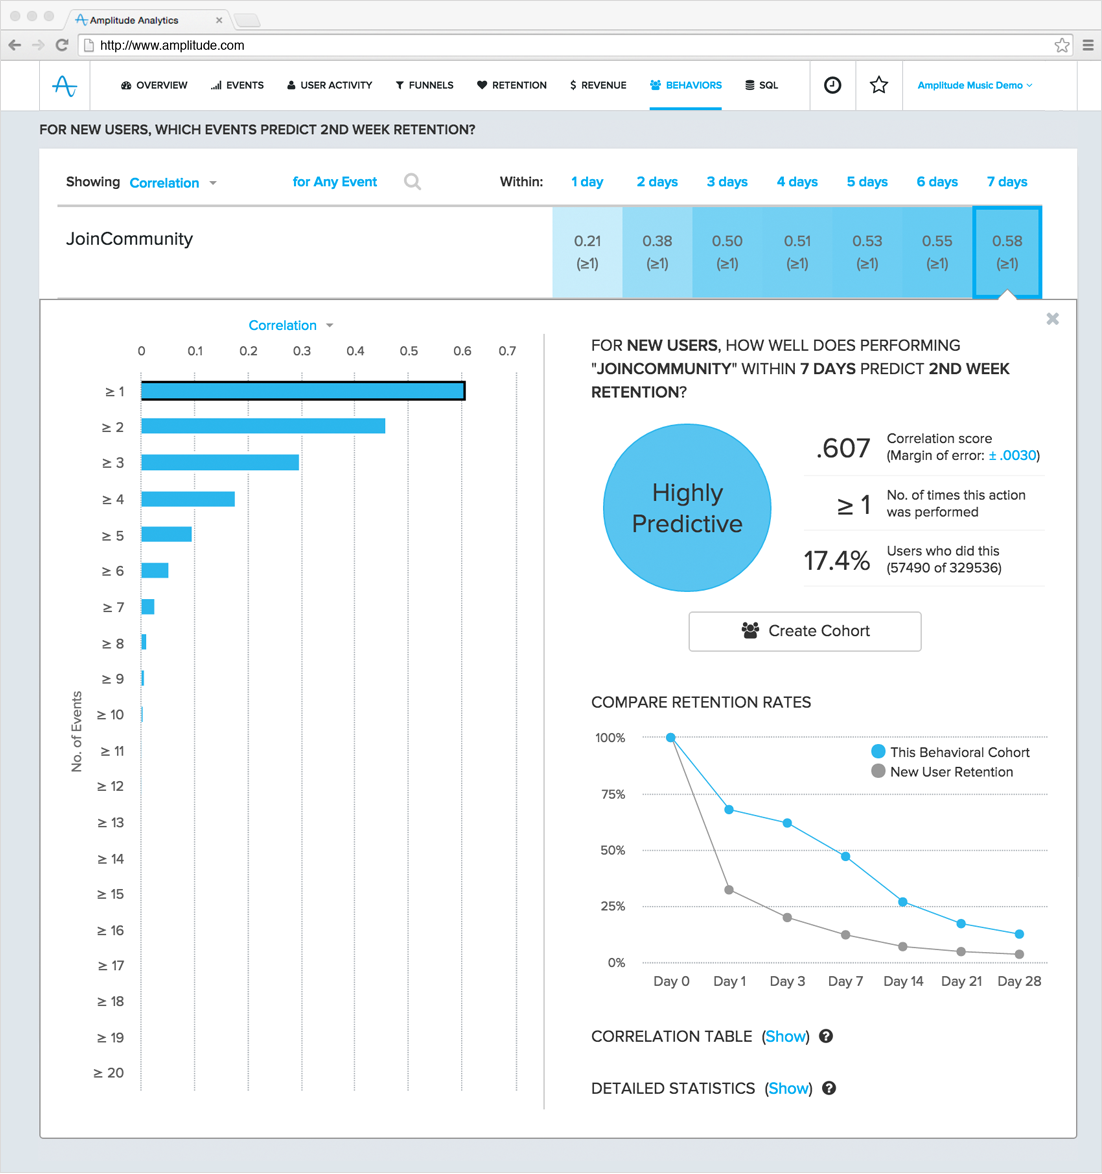
Compass’s backend data engine shows predictability by deciding which cohorts are the most reliable in driving retention and usage in the app. For instance, if you want to see how well a certain activity (like Join Community) drives a second week retention metric, the Correlation Report inside of Compass will help you. i Check it out below:
In this report, you can see the impact that the Join Community event has on retaining users over a two-week period. You can then break it down even further to see a correlation table and detailed statistics on each metric chosen. Win, Win, Win!
Google Analytics Hacks
We know that most of you are probably using Google Analytics. Below are two hacks to keep in mind when using the system.
- Use Google Tag Manager or Segment to your advantage in understanding user behavior.
- Use Regex to understand the questions users ask to get to your site; FAQs anyone?
GA Hack 1 – Tag Management and User Behavior
Google Tag Manager (GTM) is a great option to house all your analytics tags in one place. Some things to think about when using GTM:
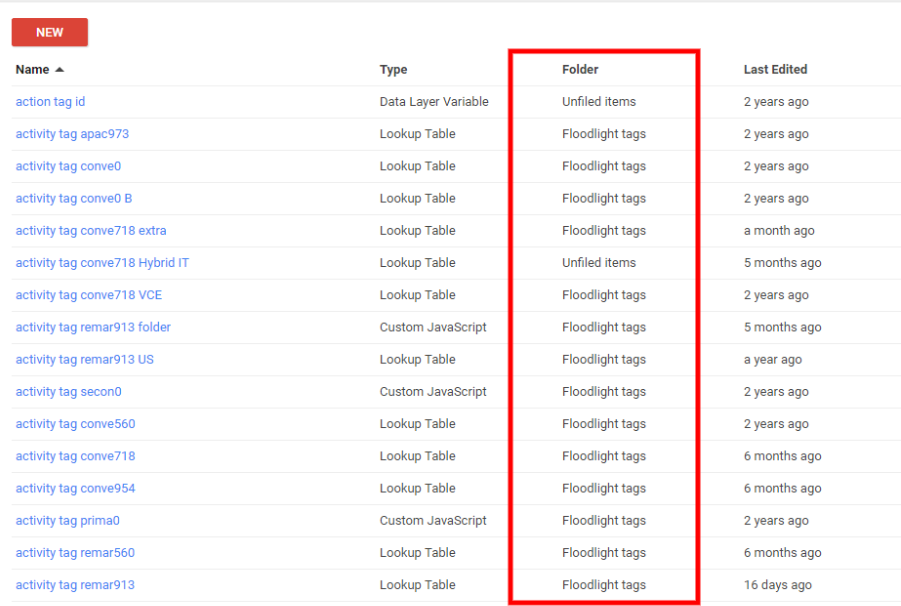
- Folders: Use Folders to make sure the team has the same tags, triggers, and variables for all corresponding tags (GA, Floodlight, etc.). Folders can also be based on different sections of your site or app. See below for an example:
- Lookup Table Variables in GTM: These variables can be used for any type of GA tag to fire a trigger for a specific type of event that will predict an overarching user behavior, like a form submission. The example below shows how a list of URLs can be categorized into a few different variables:
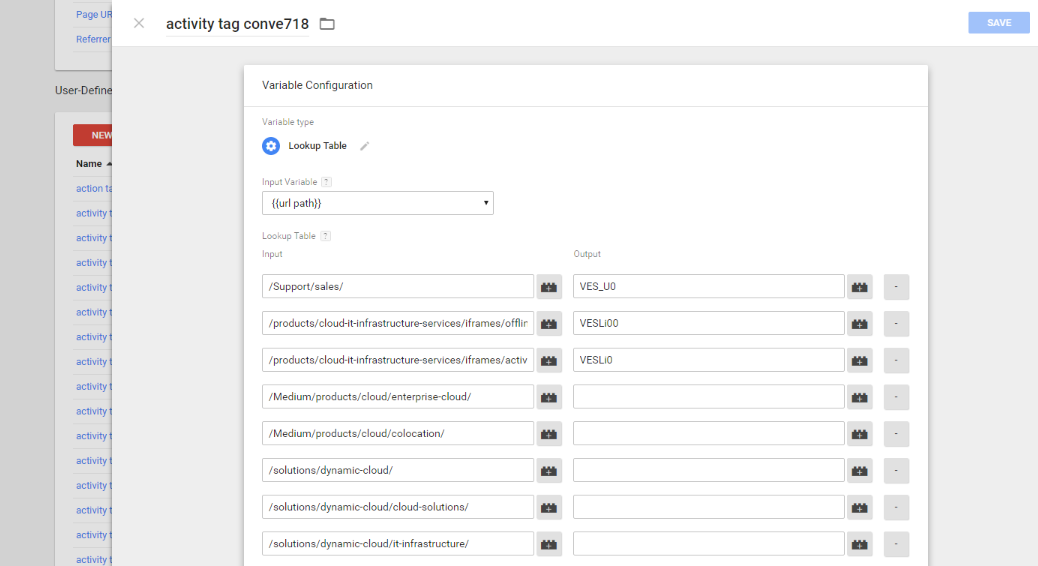
Using both of these two tag management styles will help in the long run because you’ll be able to define more clearly how a user interacts with the site based on the different Lookup Table Variables you collect and fire specific events on, and you’ll be able to better navigate your tags, which means in the future you’ll better understand your data.
GA Hack 2 – Regex and Questions driving Traffic: FAQ = SEO
Not many marketers know this trick, but it’s a good one that will help to identify what the users who actually make it to your site are looking for. This trick requires you to have Search Console connected through GA. The Regex we’re going to use for this hack is below:
\b(adding|does|do|who|what|where|when|why|how|will|can|\?|am|is|are|was|were|be|being|been|versus|vs|vs\.|best)\b
*(Search Console connected through GA Admin, based on specific user email address)
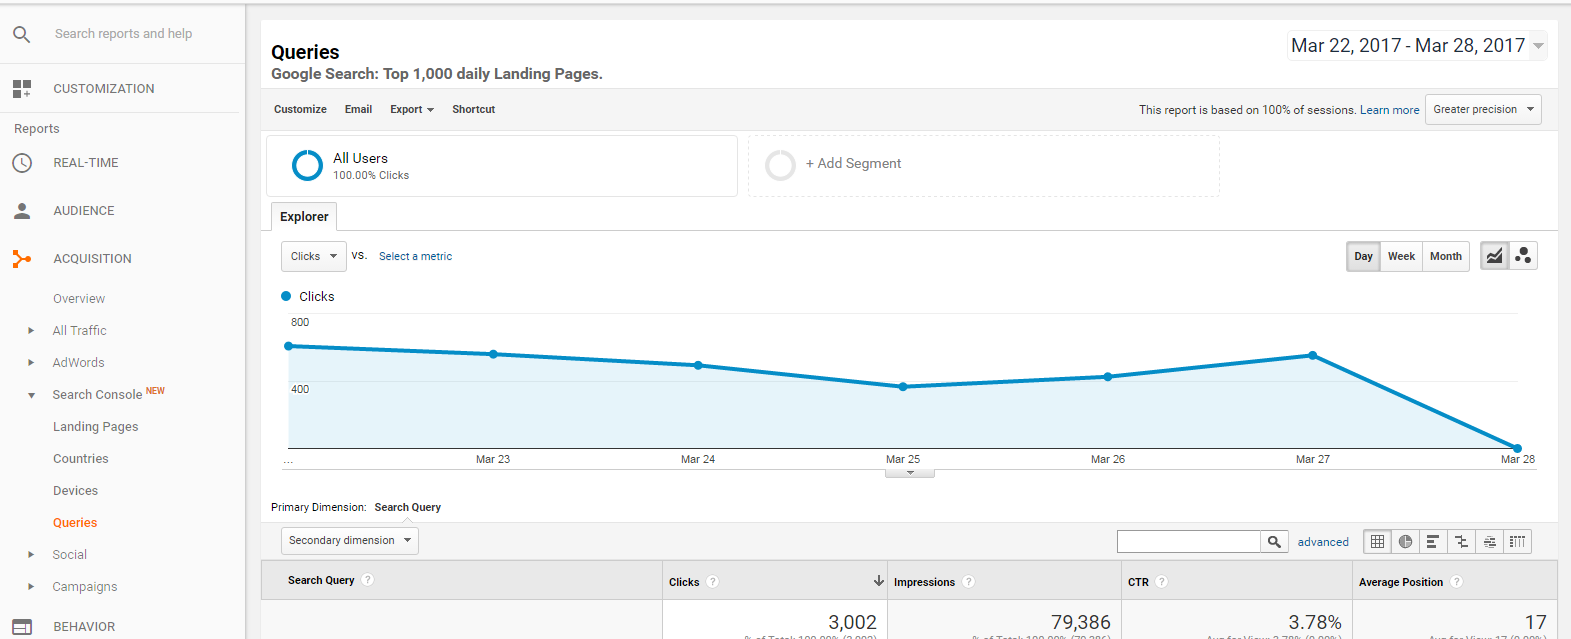
All you need to do to start seeing the questions that are sending traffic to your site is paste the Regex code above in the segment search box (see below), and hit search!

Looking at our client’s analytics (Real Thread), we can see what questions come up to the top over the past month. Below are the top ten questions that are showing to drive a significant amount of clicks and impressions:
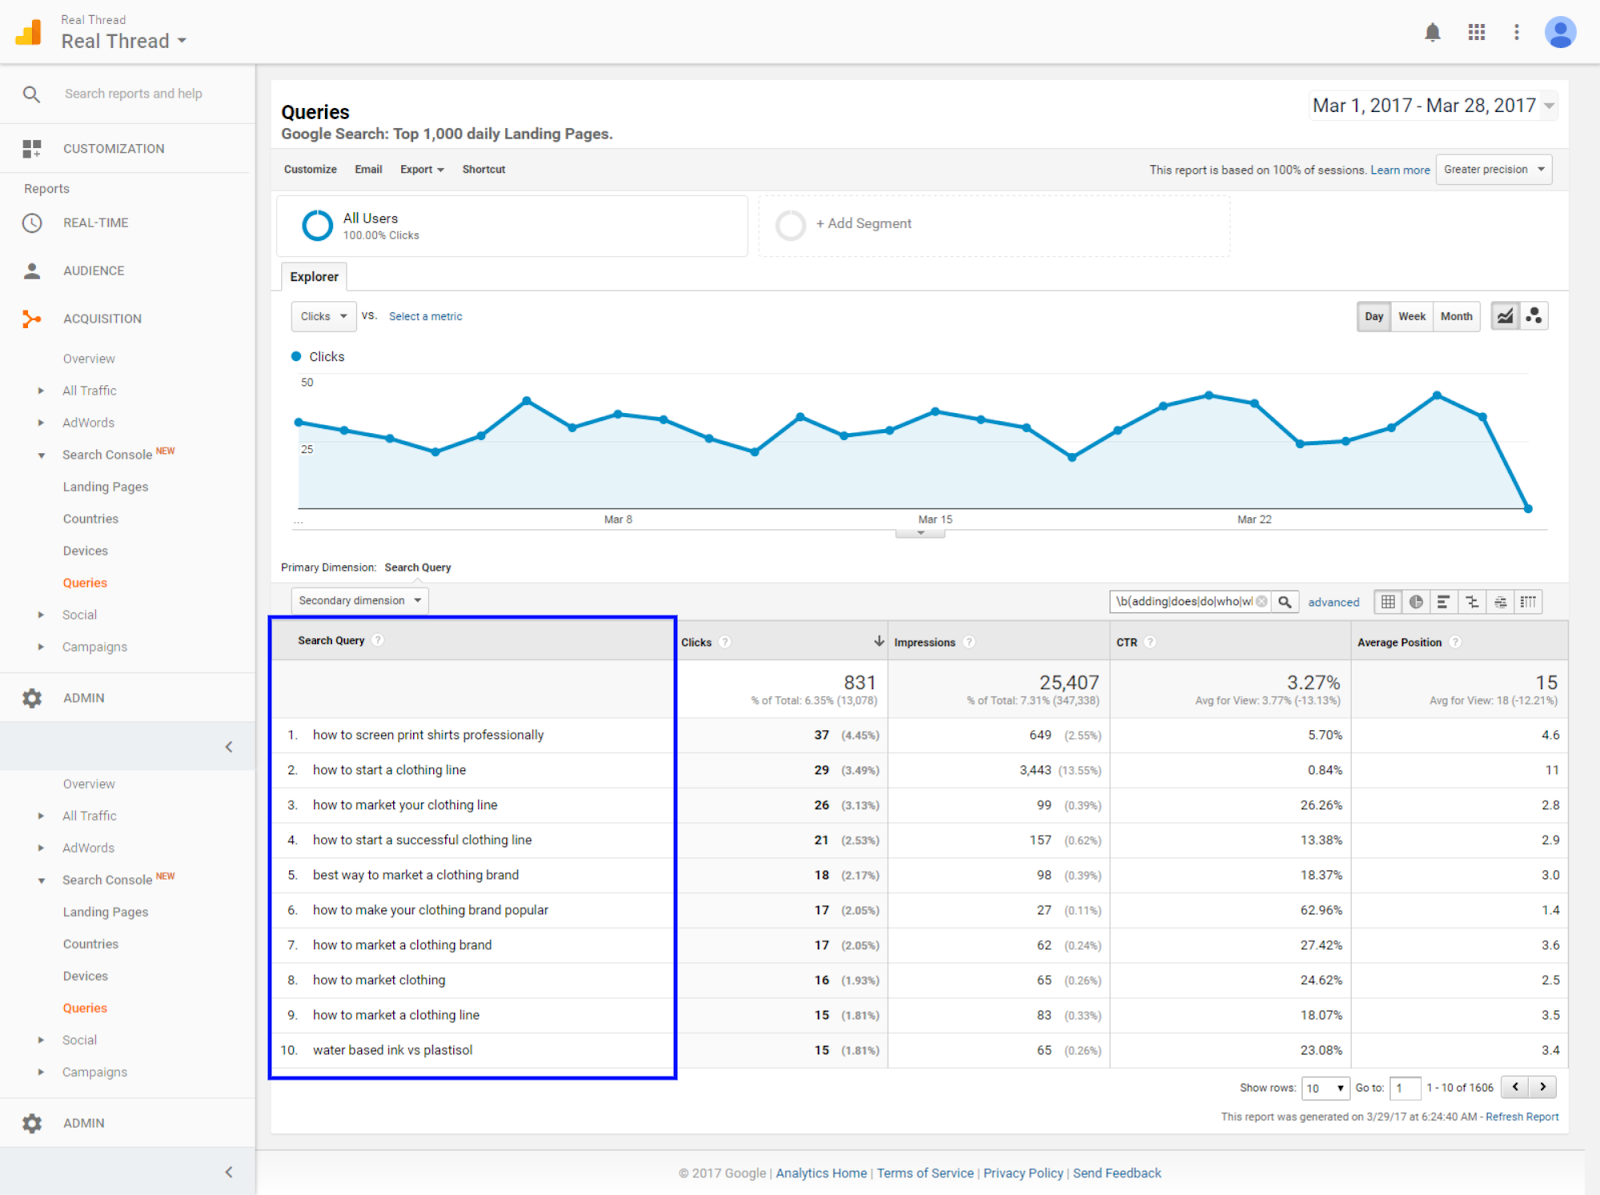
Using this hack, you can see the top questions that users need to find when they come to your site. This can help you create blog content as well as FAQ content that is dynamic and built on real questions. Or this could be used to trigger different events like pop-ups that drive engaged traffic deeper into the site.
2. Insights: What is your data telling you?

All right, so now that you have your data system integrated and the right systems in place, you’re ready to understand how users are behaving and build out an amazing CRO strategy that’s going to kick a#$!
Data is only half of the problem when it comes to understanding a user’s behavior. Now you need to identify the key performance indicators that need to be measured in order to gain insight. Hopefully, you’ve already talked through some of this when setting up your analytics events and tags, but now it’s crunch time. We need to know where the drop-off in the funnel is, what behaviors are driving users out of the funnel or into the funnel, what unique value proposition is driving sales, and how we might be able to manipulate that to drive conversions.

Understanding Your Unique Value Propositions
Simply put, a unique value proposition is a promise of value that your company is going to deliver to potential customers or clients. For instance, a value prop could be:
We Focus on Making You More Money. That’s it!
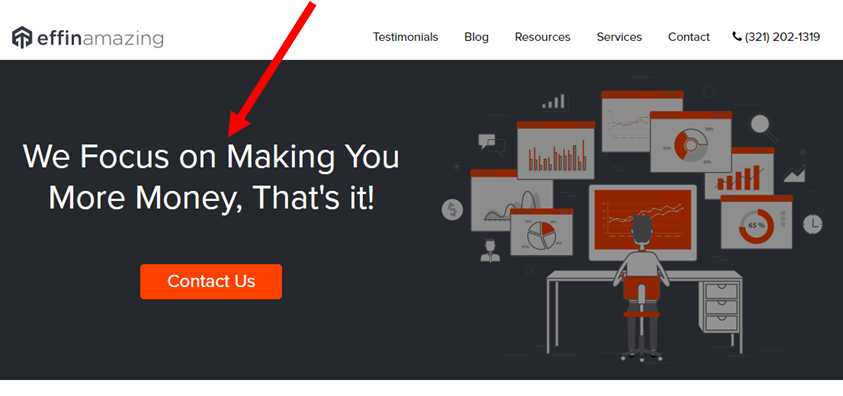
A value prop needs to be in the language of the user that is coming to the site and it needs to focus on their needs, not your need to feel special. Think, why in the very basic sense would someone want to use my services?
Unique Value Proposition Case Study
WiderFunnel uses a great case study showing what a value proposition can do for a product or company. EA’s The Sims 3 used conversion rate optimization to find what offers on the game drove the most revenue, and they increased conversions by 128%.
The business needed to get more in-game purchases through users registering the game or product. These in-game purchases drive a big chunk of the company’s overall revenue, and EA wanted to understand which offer they should use to drive more purchases.
In the end, the Widerfunnel team ran a multivariate test consisting of multiple offer options once a user logged in to the game. One version stood out from the rest in driving sales at a 128% lift. See the winning variation below vs the control:
Control

Variation:

EA found that if they had information on what it meant to register the game, the user would be able to see that it was a good option, and this drove an increase in conversions to register and make in-game purchases.
Think about your product or site. What are you telling people on it? Does it make sense for the end user? Will they know exactly what you want them to do and how you can benefit their life if they do it? These are questions to think about when coming up with your company’s unique value proposition that will drive sales.
Know Your Funnel Drop-Off Points
“When measuring micro-conversions as a progress indicator, make sure you can translate the micro-conversion to the bottom line, e.g., revenue.” Evergage Team
The biggest impact a CRO expert can have on a company will come from optimizing the funnel of the site. This is done by understanding what micro-conversions are driving revenue for your company. These micro-conversions could include viewing a product page, downloading a certain webinar, to adding a product to their cart, or viewing a checkout page. Micro-conversions in a funnel add up and give a user momentum as they complete the process of checking out or signing up on your site. If one of these elements of your site is off, it will create a bottleneck where users drop out, get distracted, or lose interest because they no longer trust you or feel your product is good enough for them to worry about.
With that in mind, you need to pick your battles. Remember not every page is worth testing. A 20% lift in a page that converts at 1% is much better than a 20% lift in a page that converts at 0.1%.
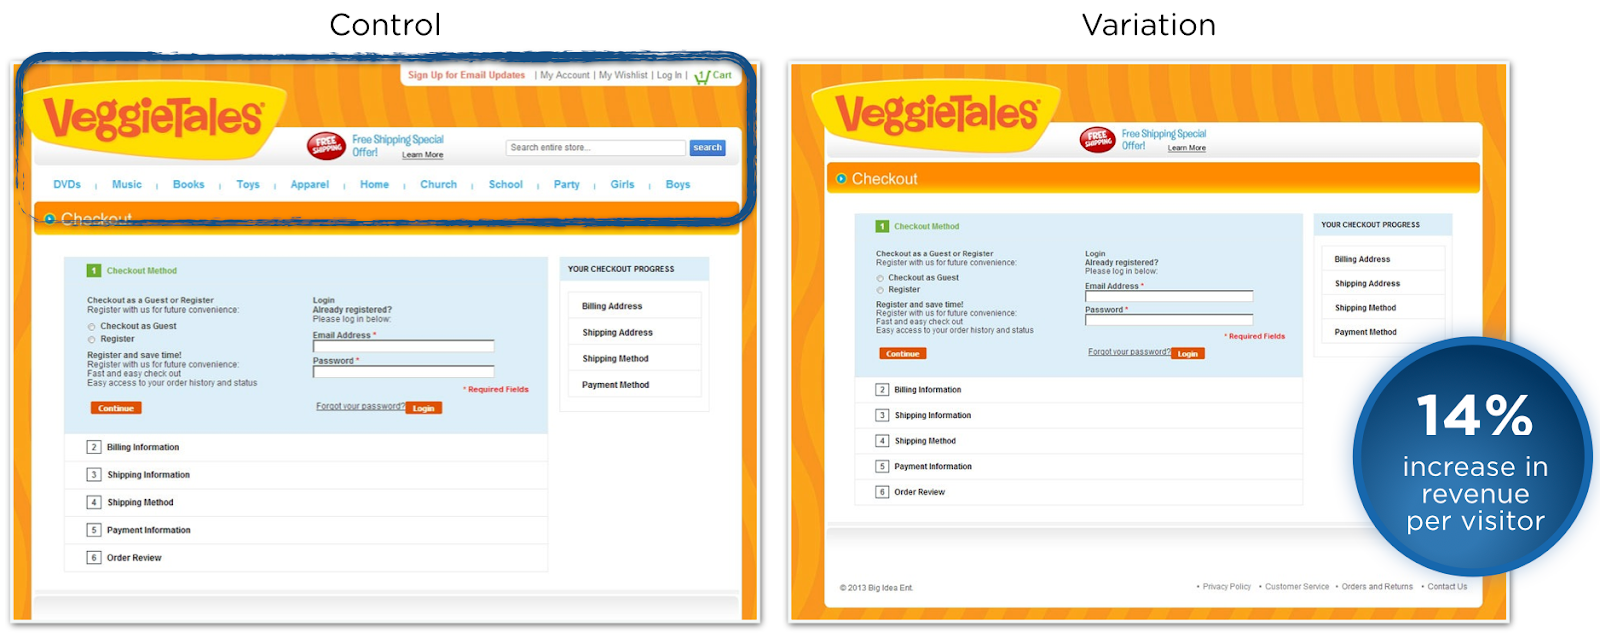
For a great example of how to simplify an ecommerce funnel, Optimizely came out with an A/B test that the popular kids show VeggieTales did to increase revenue per user by 14%. They simply took out the navigation in the shopping cart. Check out the changes below:
Actions that Hurt Conversions or Help Conversions

Once we understand where the bottlenecks are in the funnel, we can then look a little deeper into what actions a user is taking on each page of the funnel to decide whether that action helps or hurts conversions. Have an amazing white paper that you want users to download when they are on a cart page? Well, that may be distracting them from actually making it deeper into the funnel and checking out … or it could be drastically helping conversions. How do we know if that asset is helping or hurting? It’s called segmentation, and it’s why good data integration is key.
Here are some examples based on a few of the data systems we talked about:
Google Analytics: Resource Viewed Ecommerce Impact Segment
Many experts in GA know that it’s beneficial to be able to create segments on a series of different events that are built around a question. In this case, we want to see if the client’s site with a resource section is actually helping to drive revenue or hurt it. We have specific events set up through Segment that are flowing in via an Event Action that state whether a user visited the resource section. This segment is shown below. It could just as easily have been done via a page path segment, but this is what we’re working with in the current data setup.
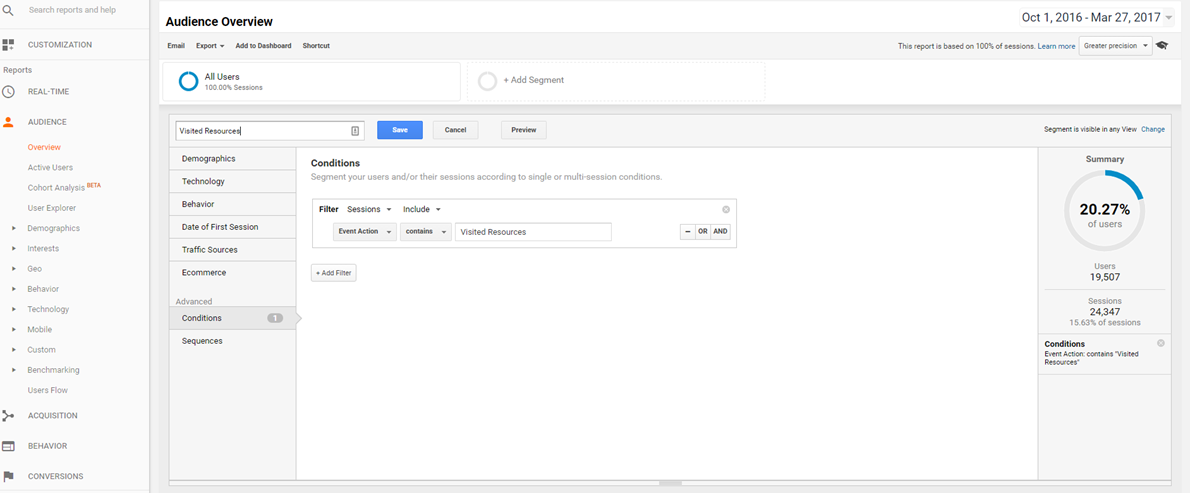
It looks like about 20% of all users are using these resources, so it could potentially have a big impact on our quote submissions. Let’s take a look.
Navigating to the conversion section of GA, we can see the following (keep in mind we kept both the new segment we just set for resource visits and all users as a baseline metric).
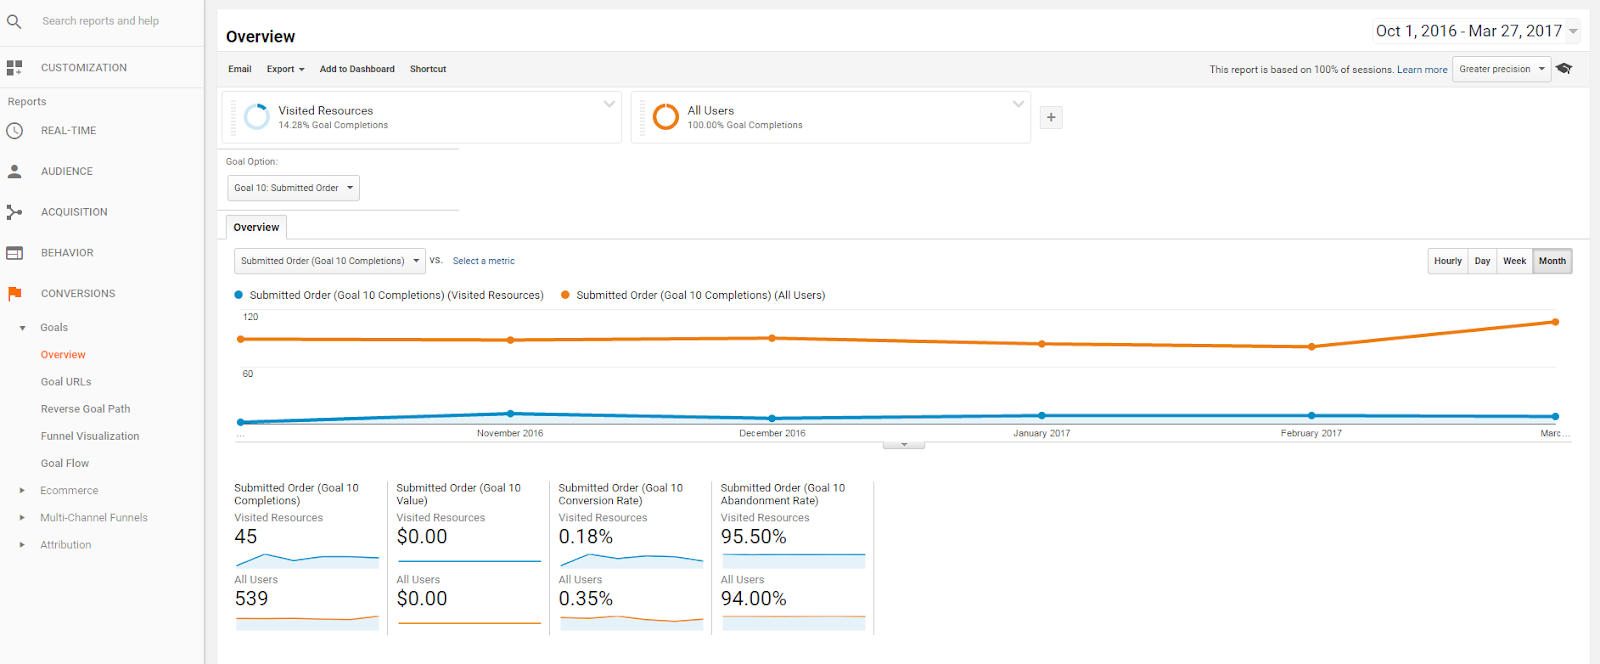
Wow, this is interesting! We can see that overall the submit order goal has decreased substantially for those users who look at resource pages (WTF?!).
This gives us something to investigate further. Why would a user decide that they don’t want to submit an order if they are viewing a resource page? Is it more of a correlation because of the type of user coming to those pages? These questions will help us get deeper into knowing what makes our users/potential customers click and why they are dropping off the site in this section.
Now, let’s take a look at how this segmentation could work inside Kissmetrics.
Kissmetrics: Resource Viewed Ecommerce Impact Segment
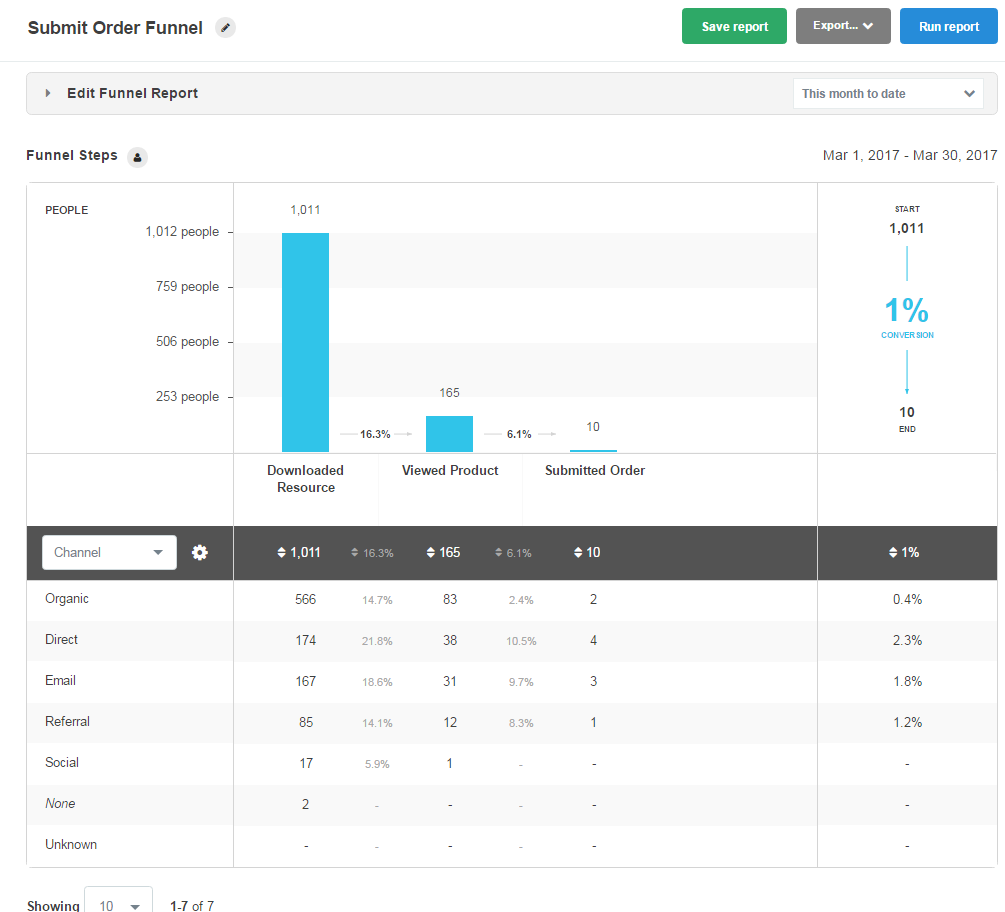
We can see that those who download a resource and then go to a product page are about 16% of all users. From there, about 6.5% will actually submit an order, though the numbers are very low (10 submitted orders).
If a user comes directly from the homepage to a specific product page, we can see that the overall conversion rate for that funnel is 1.4% vs the 1% for those who actually download a resource.
These metrics line up with what we saw inside of GA, but it gives us another view as well. Those users who actually make it to the product page from downloading a resource are 2 times as likely to submit an order, even though the overall conversion rate for the group may be smaller.
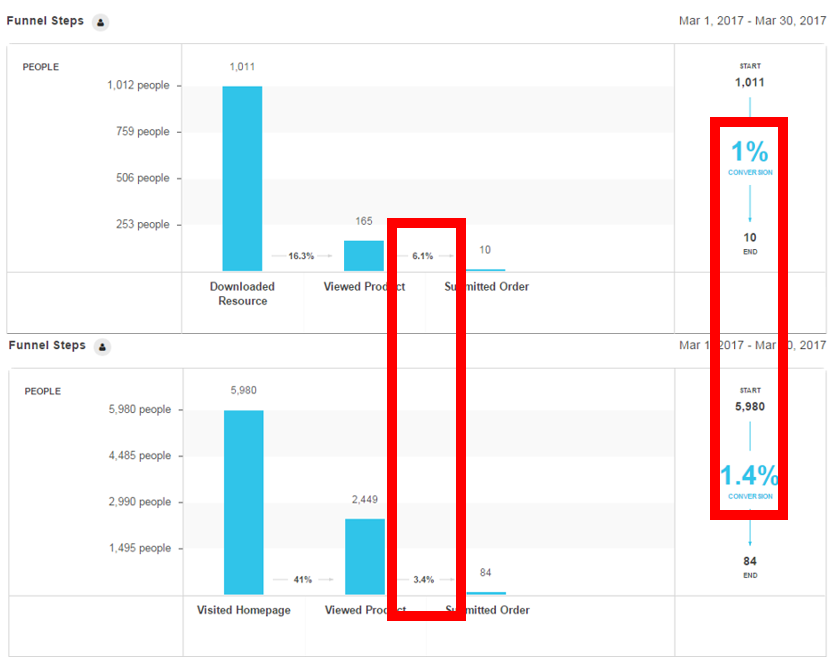
This is something we’ll need to account for in GA or any other type of system and segment for those users who make it to an actual product page and then submit an order.
Understanding Attribution and Traffic Drivers

“Proper attribution modeling is one of the biggest challenges facing marketers today.” Christi Olsen, Search Engine Land
Now that we have a good idea which user actions are driving conversions and where there are bottlenecks in the funnel, we need to understand what type of traffic we’re getting to the site and how the funnel differs for each type of traffic.
Some key things to remember here, because we could put a whole series of blog posts about attribution problems and how to’s.
- All traffic that gets lost in direct traffic is not useful. If your SSL is not updated to be HTTPS you are losing traffic information, and it’s being bucketed in the black hole of direct traffic! Checkout this post by Himanshu Sharma on Optimize Smart about how direct traffic is increasing due to SSL protocols.
- All analytics systems need to be on each step of the funnel, and if necessary have cross-domain tracking set up (think of subdomains that your campaigns could be driving users to). If not, all traffic reports will be totally messed up and have a lot of self-referral and direct traffic issues. Learn more about cross-domain tracking here.

- No matter what, make sure all campaigns are tagged correctly for your specific system of analytics. Use UTMs! Campaign parameters ensure that all traffic is accounted for and used in attribution modeling so that all costs and revenue are accounted for when thinking about a specific campaign. You as the marketer or analyst are the last hope for parameters to be used correctly. Set up a framework and tell your campaign or media buyers that they MUST be used correctly, or else! Check out how we do it with our UTM Builder Chrome Add On Tool.
Use a uniform tagging solution for your company. Check out McGaw.io’s Campaign Parameter Builder.
With these three things in mind, you can navigate the murky waters of understanding attribution inside your specific analytics systems and build out an attribution model that will help you identify what marketing activities and assets are truly driving conversions. This can definitely be a hard process depending on the level of complexity your site has in subdomains, landing pages, and types of campaigns. Luckily, this is what we specialize in, so hit us up for some analytics help if you need it.
3. Test-based site design: Get ready for some CRO fun!
The previous two steps set up companies for success when it comes to a CRO strategy. Understanding your overall data setup, how your site is performing and how it might improve, and what traffic is working and what isn’t working is essential in setting a testing framework that will drive success for your company.
The cliche still holds true: “Good data in, good results out.” The same goes for testing in general—if we base our tests on good data, then we’ll be able to find real results and continue to drive growth for our specific companies or clients.
Before you start testing, you need decide which tests go first. The McGaw.io team likes to use the VICE Framework to decide which tests should be given priority.
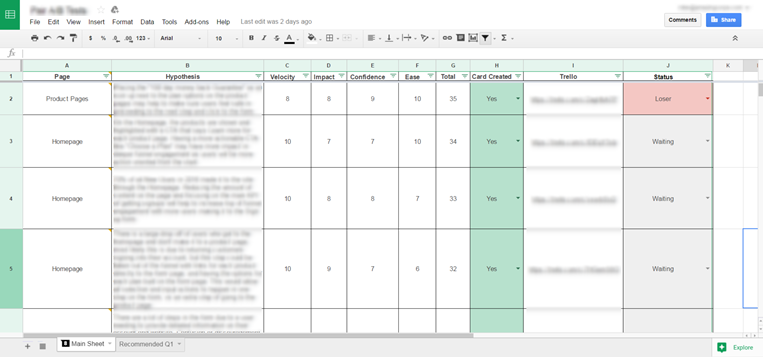
The VICE Framework is a Google Sheet we set up to help us identify which tests are the highest priority for us or a client, and it can be a source of all test ideas, outcomes, and upcoming hypothesis that need to be discussed with a client or team.
VICE Framework Description:
- V – Velocity: How much traffic does the element or page that you want to test receive? If it has a good amount of traffic compared to the rest of your site, it scores high on the 1–10 scale.
- I – Impact: What impact is this test going to have on overall conversions? If it’s high, then it scores close to 10 on the 1–10 scale.
- C – Confidence: How much confidence do you have that this test will actually work? Gut check time. If your confidence is high, then score it close to 10 on the 1–10 scale.
- E – Ease: Will this test take a lot of development time? If so, it scores low on the 1–10 scale.
Using this framework, the Effin team comes up with 20 or so hypotheses to go over as a team. We use the rankings to determine which tests go first. Only then do we start the process of A/B testing.
Running the Tests
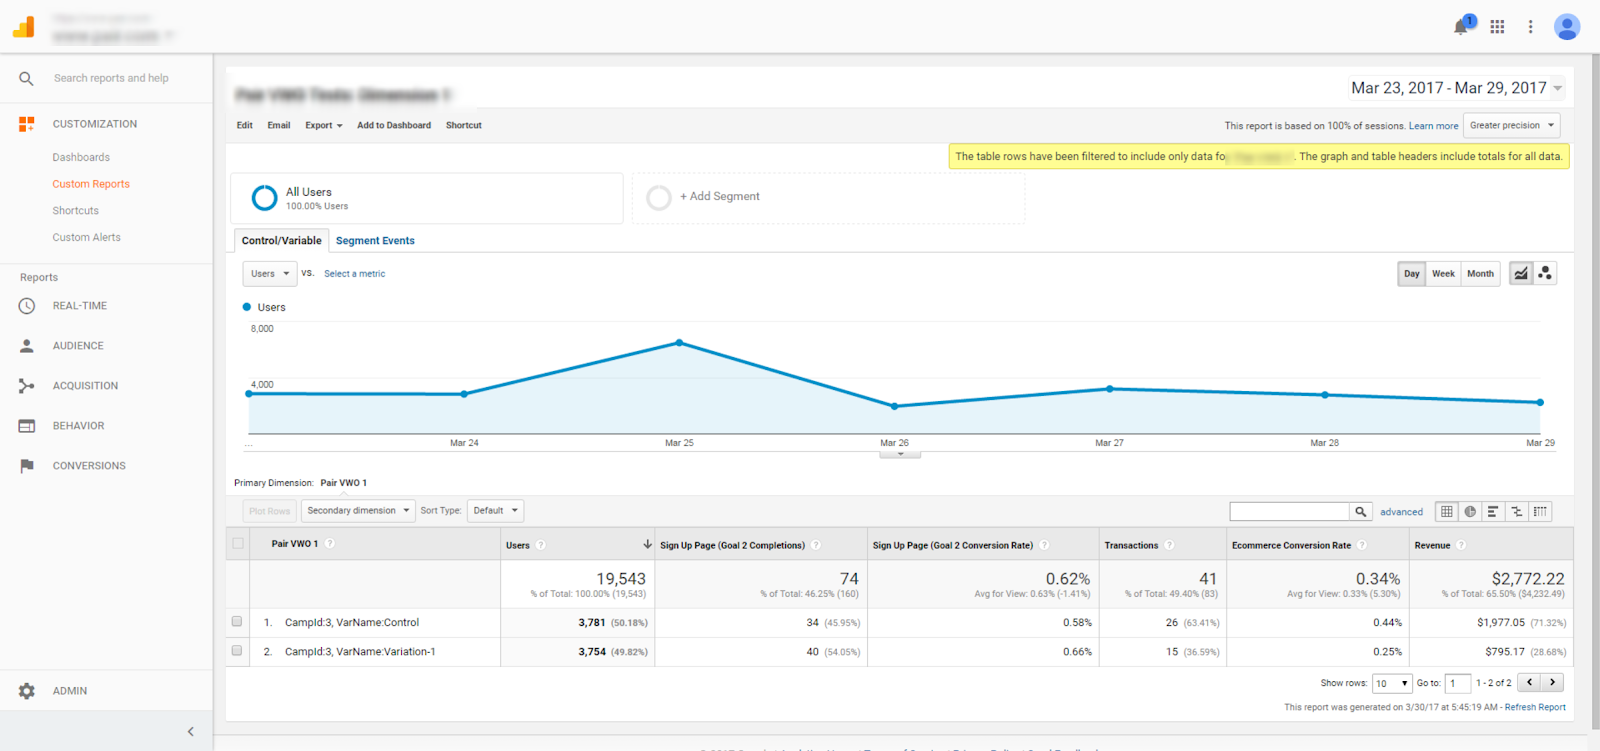
Whichever system you choose (Optimizely, VWO, Adobe Target, etc.) needs to be integrated with your selected analytics system. This way, all funnel and engagement analysis can be done both inside of the A/B testing tool itself and inside your system that has been specifically set up for your site. This will help you to understand the difference between the control and Variation at a much deeper level.
Integration shown with Amplitude
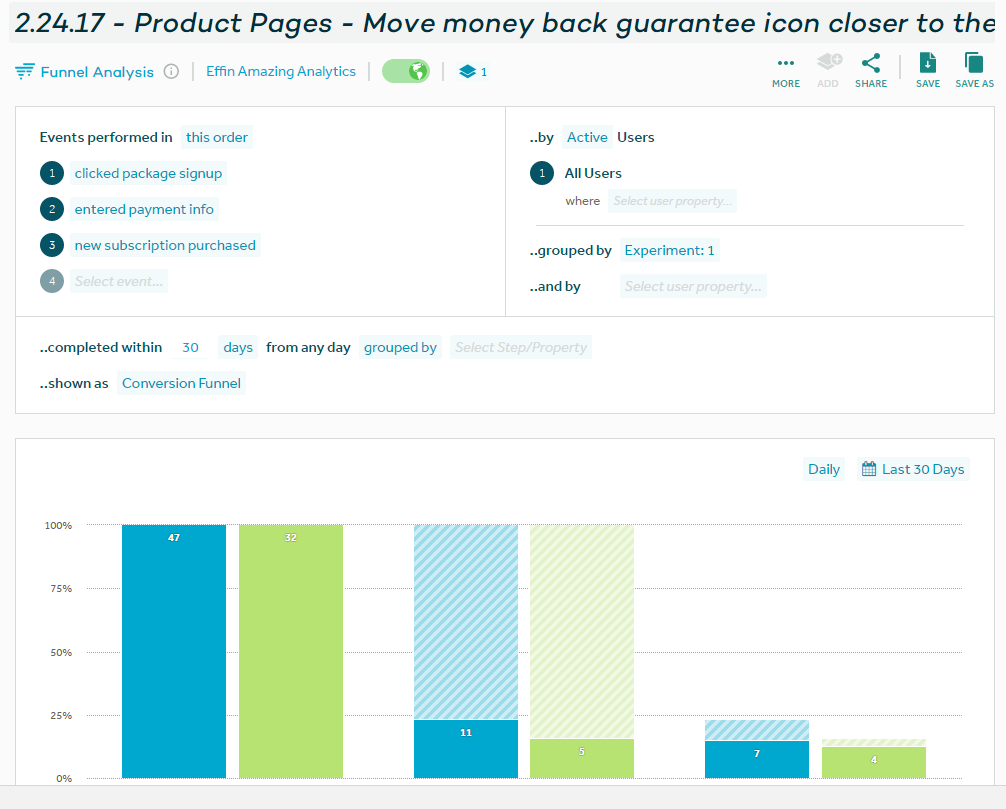
Integration shown with Google Analytics
Calculate Significance with Test Calculators
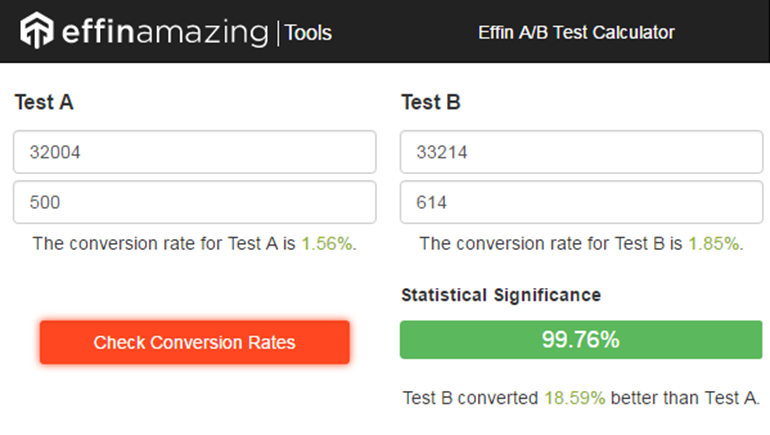
There are multiple options when it comes to A/B test calculators, so the Effin team decided to just build a plugin for Chrome to be able to see if a test is performing well on the fly. Check out the tool here (Screenshot below).
Never Stop Testing
Your users and site will always be in a state of flux. The internet always changes the way a user will react to a certain element or design on your site. Your campaigns will end or will increase depending on budget.
All of this means that your testing cycle for your site and funnel conversions will never end. Having a continuous CRO strategy will help you to keep flowing with the ever-changing response users are going to have to your site. For instance, a test that worked to increase conversions six months ago might actually hurt conversions now due to the fact that users are used to utilizing your form in a different way than before.
CRO strategies really only work if there is continuous testing. Since we all don’t live in a lab that has controlled baselines, we need to be able to run back-to-back tests to ensure all testing has continual significance. Many marketers get hung up on the fact that we can’t conduct true scientific experiments because of the many different factors that go into online traffic and consumption. This is true, but as we take part in continual testing, the science behind the tests becomes truer, and we began to see a bigger impact on our conversion rates and overall conversions because of the validation of many smaller experiments.
For more on why it’s so important to continually test, check out this blog by Kissmetrics on the differences between scientists, impatient marketers, and realists.
“In all of our models, being vigilant and continuously running tests is a sure way to minimize any limitations in the testing methodology.” Will Kurt, Data Scientist/Growth Engineer at Kissmetrics
Case Study on Site Design by A/B Testing
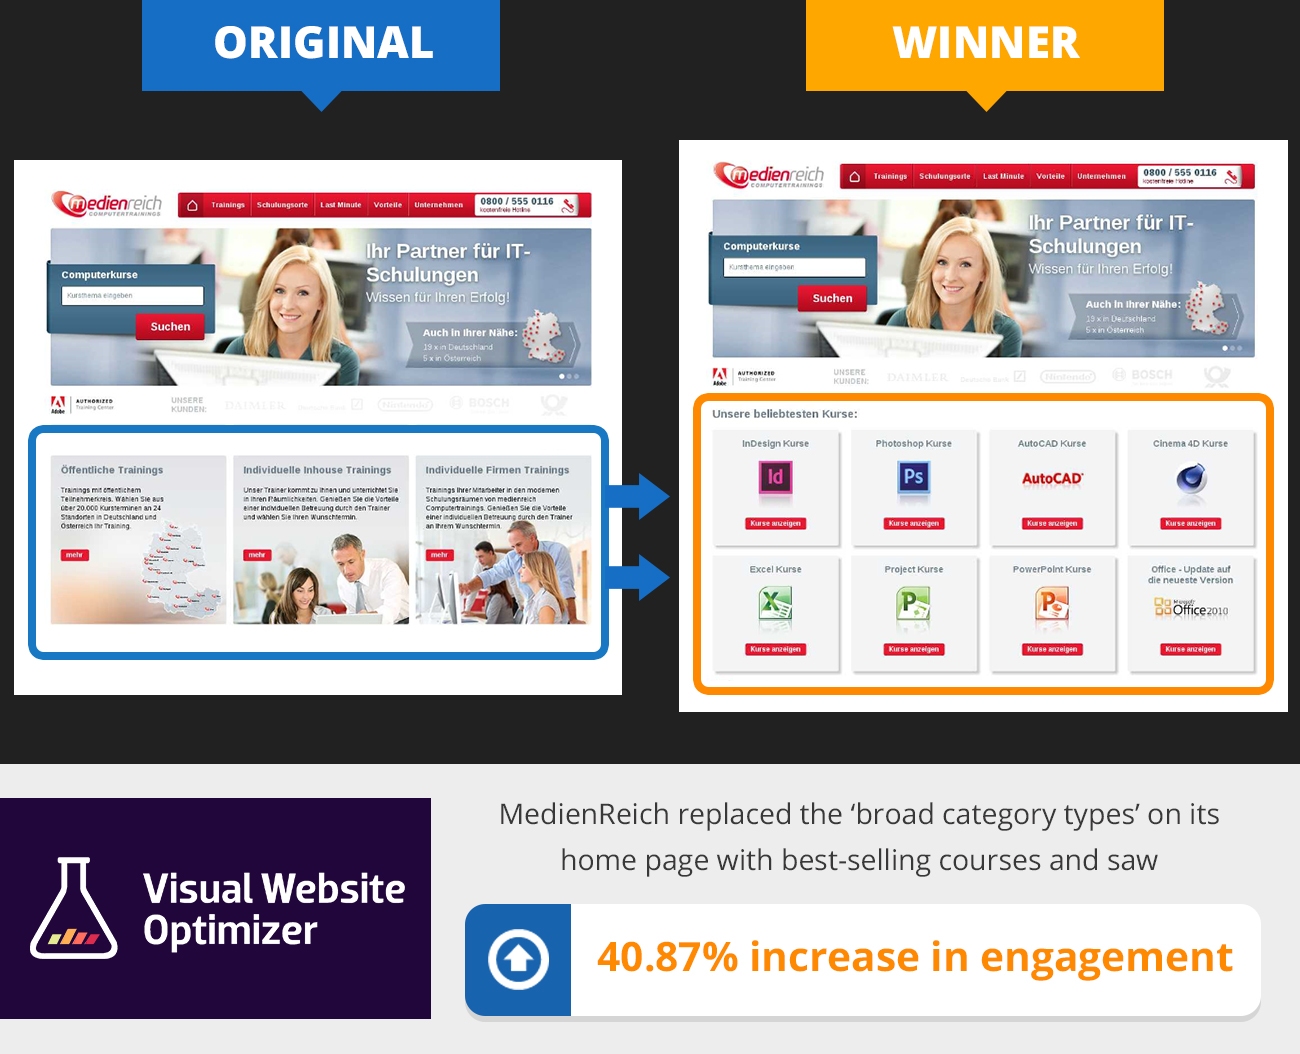
One of the best case studies that shows how A/B testing can lead you to a new site design came out in 2013 and was chronicled by Visual Website Optimizer. A company that used their services called MedienReich, a computer training company, tested how changing the layout of their homepage would benefit the overall conversion and engagement on the page.
The Test
MedienReich’s homepage showcased the different services they offered for those looking to get a specific type of computer training. Think of them as large buckets of different products they offered, or categories of products.
Control
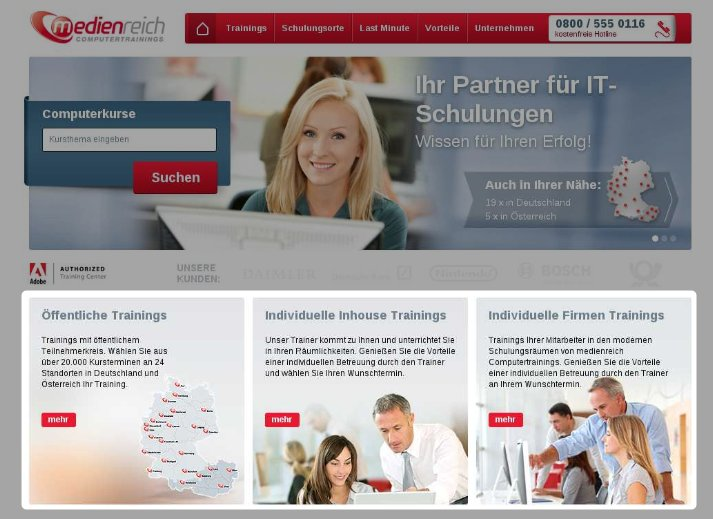
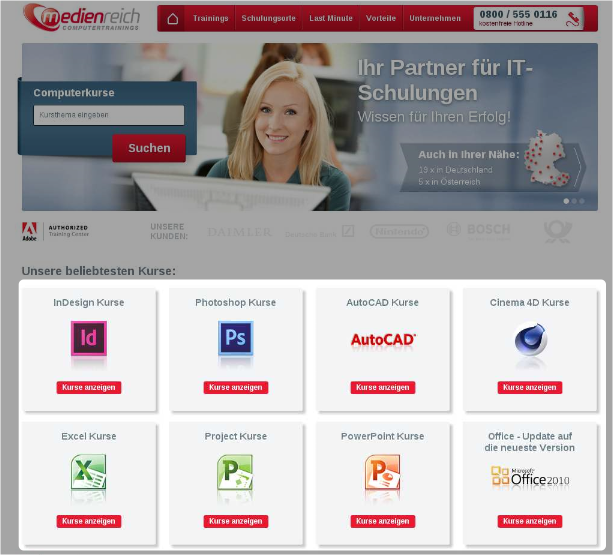
The company wanted to see if adding specific information on courses to the homepage would help to get users deeper into the funnel and reduce drop off from the page. See the variation below:
Variation
The Results
After 20 days, the variation showed to have a promising effect on traffic reaching MedienReich’s homepage, increasing engagement by 40.87% with a 99% statistical confidence.
This showed a big shift in thinking for the company about how to organize their site. Before, the company had decided to put a layer above the specific products to locate them into specific categories, but we see that customers wanted to get to the products faster. With that insight, MedienReich could now look at their overall site and begin testing the navigation, product categories, or site map to see if there could be more benefits from reducing the funnel size of the site.
Below are three things to keep in mind when thinking of designing a site with the help of A/B testing:
Site Design: Things to Keep In Mind
- Provide the right info in the right order: Your site is a story that needs to give direction to users about what they need to do. Don’t forget that a user needs a simple way of finding your company’s key value proposition vs your competitor’s. The right information at the right time is key to helping visitors convert.
- Think from the user’s perspective: Buyer personas are key here. Who are you marketing to? Why would they want to buy your product in the first place? Think of what your website is telling them and if you would actually like to buy from your own website. What does their journey look like in the buying process? Thinking about these questions will help to guide what elements and funnel steps you put in your site.
- Display your best on key landing pages: Look, we’ve all seen it before. The homepage or any other key landing page for a campaign basically looks like an extension of what a CEO thinks should be on there. Most of the time, this doesn’t work too well. What is your best value to your customers? Highlight that shit, and put it front and center.
A/B testing will help you to answer these questions. Site design needs to be interactive. Through A/B testing and other qualitative data like surveys, users will tell you how they want to interact with you. If you’re listening, then you can guide your site to actually be useful and helpful in building a user’s trust in you and getting them to buy and be your client or customer.
Summary and Key Takeaways
- Data is king: Think about your data stack. If it’s not integrated, it’s not working.
- With good data you get good insights. Think about the feedback you’re receiving, and try to get as much as possible.
- Tests can begin small, but they need to scale to understand the overall impact your funnel’s user experience has on making your users mad. Testing is iterative—each test should build on the next. All data should be analyzed, and you should have a repository for future testers.
- Build a framework (like the VICE Framework) that will help you to decide which test will be the best to launch first. Hard tests make CRO teams sad, so choose wisely.
- Never stop testing your site. Scientific significance depends on the continual change you find in each of your test iterations. Each test should build on the others as your site begins to take shape and become the site you want it to be for converting power!
For more information on how the McGaw.io team can help you build out an awesome CRO strategy, contact us and we’ll team up with you to make your site a converting ninja.
Leave a Reply