
Marketers are always looking for better ways to understand data and make data based decisions on campaigns and site performance.
Overall, this has been somewhat difficult to do with Google’s out-of-the-box Google Analytics Dashboard and Custom reporting tools. There was a limited amount of customization and the visual appeal was lacking.
Now, however, there’s a whole new player in the Google Analytics suite, and it is making a huge impact in the marketing world. Google Data Studio is the dashboarding tool analysts and marketing teams have been dreaming about for years.
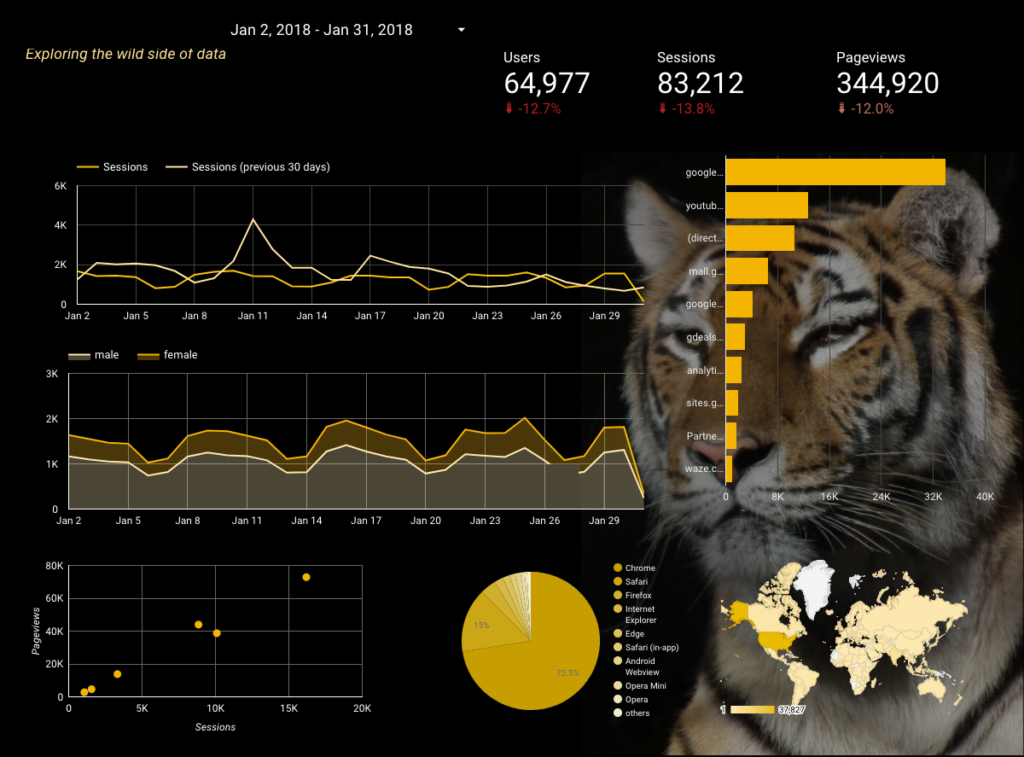
Caption: Data Studio allows you to create visually beautiful and compelling custom views of your data.
Data Studio allows you to easily bring all your data analysis together with the help of pre-built data connectors, including connectors for AdWords, DoubleClick, BigQuery, YouTube, MySQL, and many more; to create beautiful and compelling visualizations with custom designs and graphics; to transform your data into charts and graphs; and to collaborate in real time with your team, watch edits as they happen, and save changes automatically, just like Google Docs.
Want to start utilizing this tool effectively? We’ll show you how in this post.
Data Studio Basics
There are a few things you need to know when setting up a Data Studio Dashboard. Here are a few rules/guidelines:
- Data from data sources follow the same rules they have in their respective systems. Remember that some Google Analytics dimensions and metrics can’t be used together. This is the same in Data Studio.
- Data Studio can be integrated with Big Query, SQL, and a host of other services, just make sure you understand the implications of utilizing 1st party and third party data in your reporting (ie. privacy policies etc.)
- Dashboards should always be utilized to better understand data specific to your audience. The template we’re going to show in this blog post is for a high to mid level manager looking for data specifics on different campaigns and site performance.
Setting up your first Data Studio Dashboard and Template Link
Getting started, we want to have a specific goal in mind as we build out a dashboard. The template in the link below will give you an overview of your site based on different metrics for acquisition, user behavior, ecommerce, organic search and paid campaigns.
Here is the template link to utilize for building your first dashboard:
Click here to open the Data Studio template
This dashboard includes references to Google Analytics, Search Console, and Adwords. Note that you’ll need to change all of your data sources so that the dashboard works correctly for you.
Next, I’ll show you how you can do this:
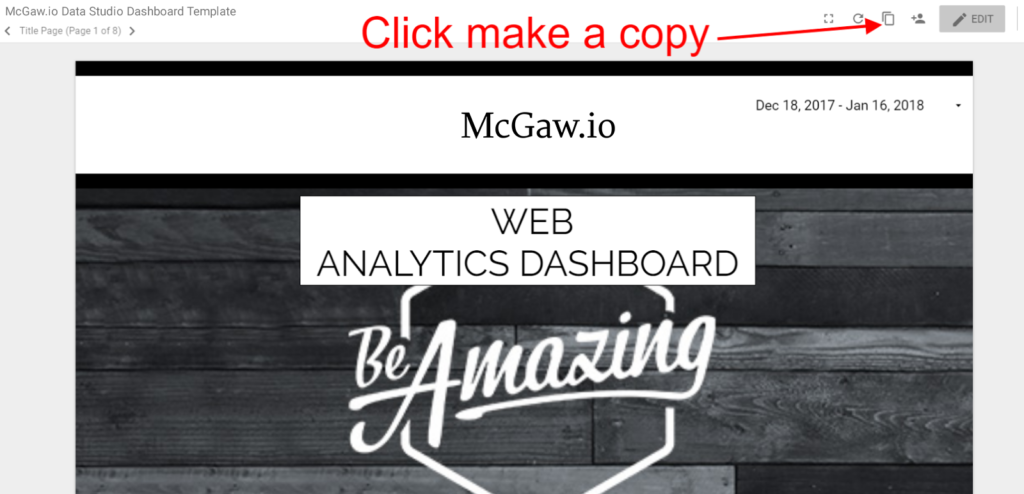
- First, you’ll want to make a copy of the template above. In the navigation bar, on the upper right side of the dashboard, click on the button to make a copy of the dashboard.
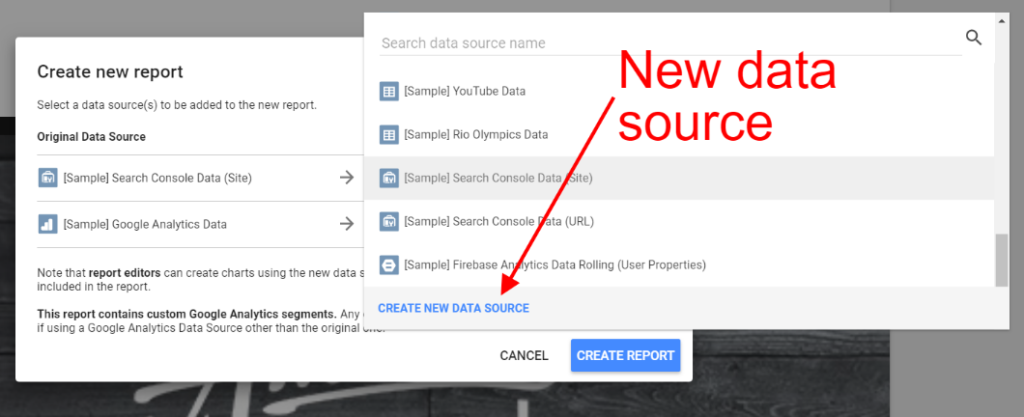
- Next, you’ll be given the opportunity to update your data sources so that they are aligned with the data you want to show in the dashboard. If you haven’t used Data Studio before, you won’t have any sources set up. If you have, you can skip this next step, otherwise if you don’t have the correct data sources for the dashboard click the “Create New Data Source” link shown below.
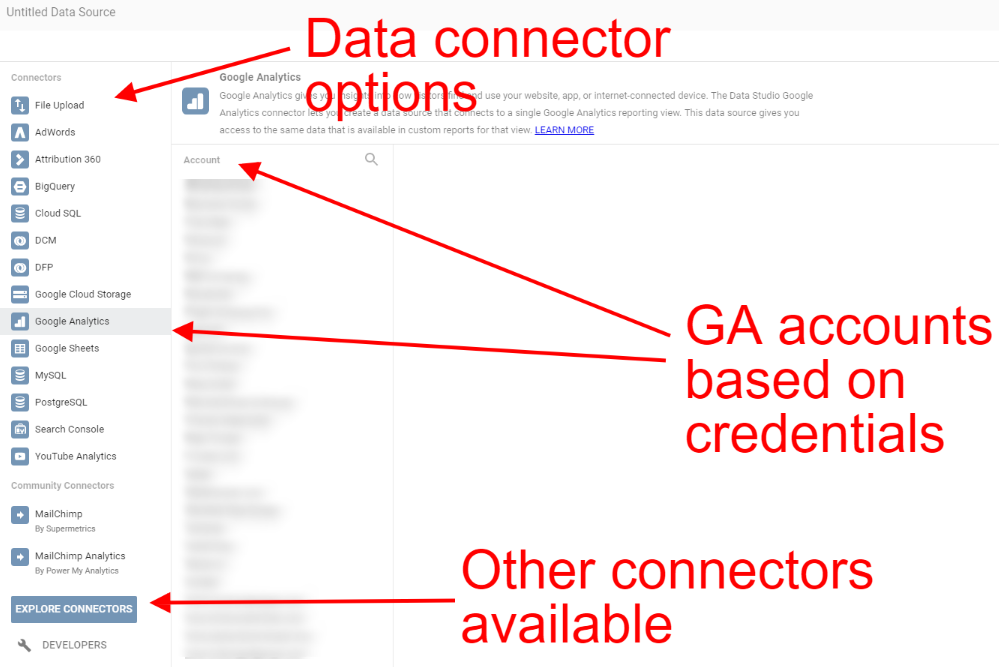
- Once you get to the New Data Source screen, you can then choose which data systems you want to integrate into your dashboard. Note that for this to work, you need to be logged into an account in your browser that hosts these different systems. For instance, if you want to bring in your Google Analytics data, you’ll need to be logged into the account that hosts the GA data you want to pull in. See below for the screenshot:
- Set up your Google Analytics and Search Console connectors, and then you’ll be taken to the new dashboard.
Inside of the new dashboard, you’ll see 8 different pages available. Below I’ll walk you through how to interpret and update these pages:
Data Studio Dashboard Template – Title Page
The title page is page 1 of 8 as you can see in the upper left corner of the navigation. Editing this page is pretty simple: you’ll want to replace the logo and hero image. It’s meant to be the front page of your dashboard. See below for the screenshot.
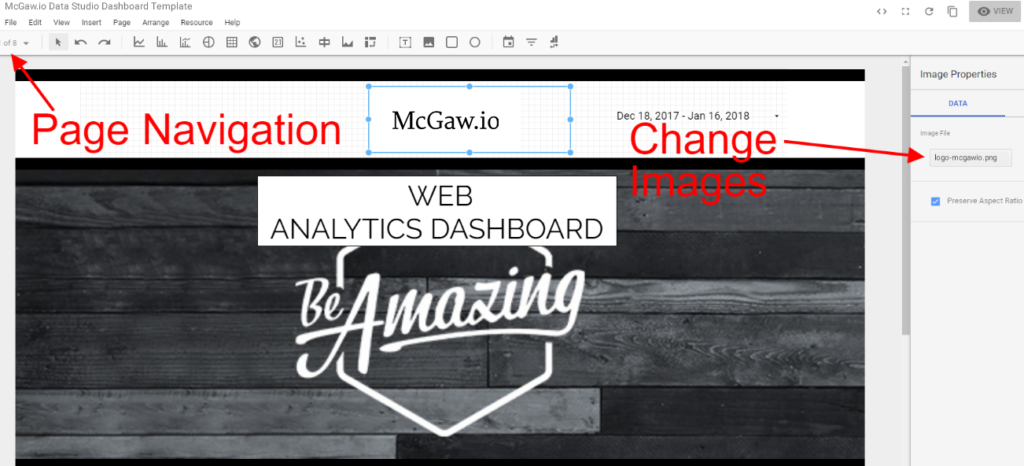
You’ll notice that there are a lot of different options when you start playing with the dashboard. Just don’t go too crazy and make it look funky :)
Data Studio Dashboard Template – Overview Page
The Overview Page contains metrics that are easy to view and understand at first glance. These metrics give executives an easy way of understanding how the site is performing. Note on this page we include data from Google Analytics and Adwords. We haven’t walked through how to add Adwords as a data source yet; next I’ll go over those steps.
Add Adwords as a Data Source
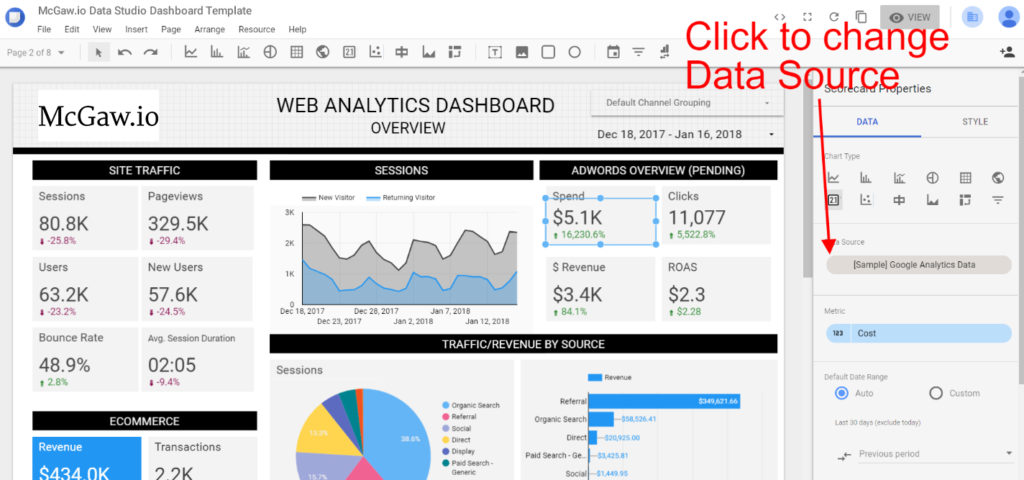
- Click on the one of the Adwords metrics shown on the right side of the dashboard. This will bring up the data properties option that you can utilize to change the metric. With the properties shown, click the Data Source.
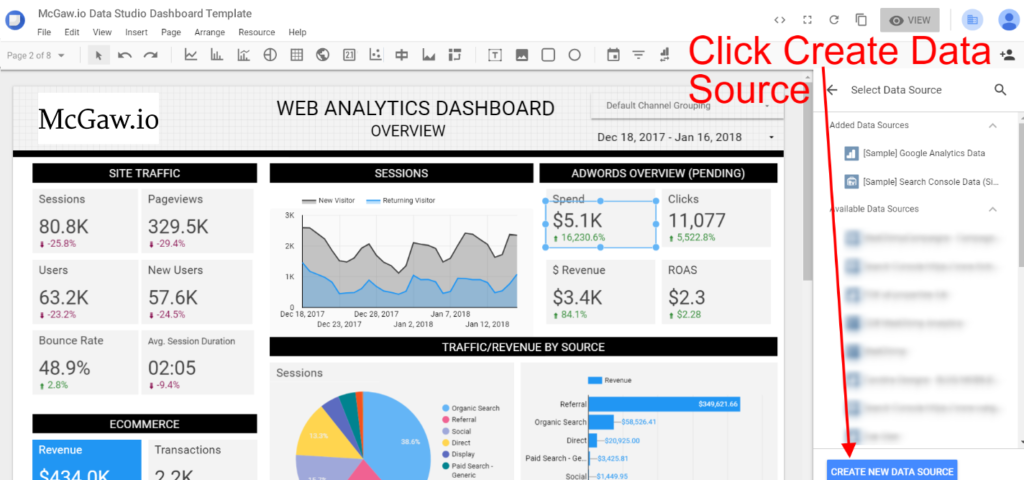
- Once you click the Data Source link you will get a list of all your available data sources and a button with the ability to create a new data source. Click the “Create New Data Source” button.
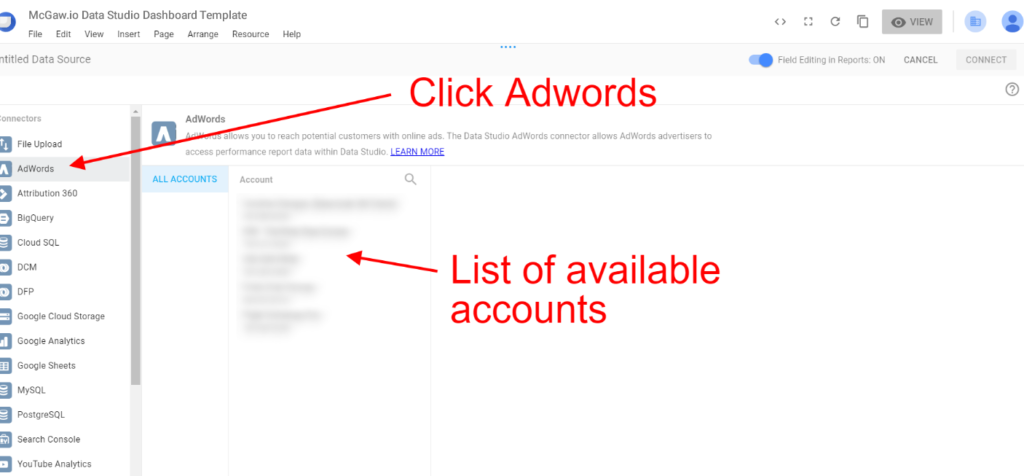
- When you get to the Data Source list, Click Adwords and you’ll see a list of available accounts under your current login that are available. Choose the one that you want to import into the report. Then click Connect in the upper right corner.
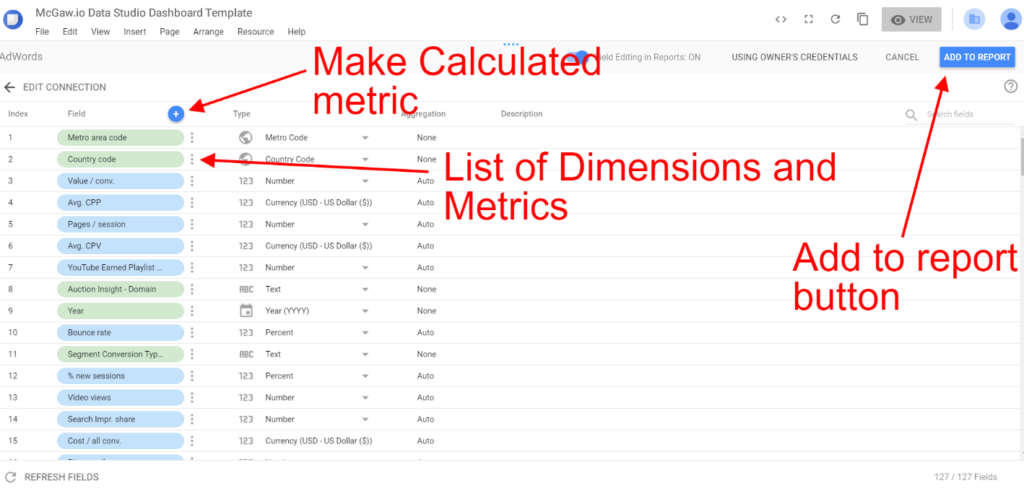
- Once you’ve done this, Data Studio will show you a list of Dimensions and Metrics that are about to be pulled into your dashboard that you can utilize. Here you can also add calculated metrics if you so desire. Note that Adwords brings in over 127 new dimensions and metrics — pretty sweet, huh! Once you’re ready, click the “Add to Report” button.
With Adwords linked as a data source, now you can go back to the Overview page and update all your Adwords metrics to be linked to the appropriate data source.
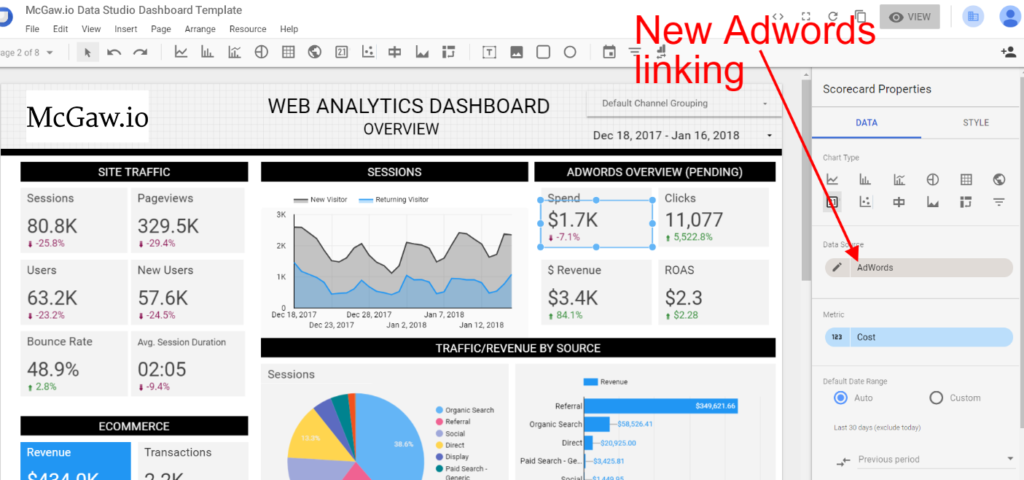
Note that when you update a data source, you’ll also need to update the Dimensions and Metrics.
Data Studio Dashboard Template – Ecommerce Summary Page
The next page is specific to Ecommerce. If your site isn’t an ecommerce site, then you can go ahead and delete this page.
If you are an ecommerce business and Google Analytics is setup with Enhanced Ecommerce, you’re going to love this dashboard. Overall, the goal of this dashboard is to generate ideas about performance throughout your funnel so that you can understand where the bottlenecks are. First though, we need to add some calculated metrics to the dashboard so that we can calculate the drop off between each stage of the funnel. You can see in the Ecommerce funnel below that we don’t have the Drop off metrics calculated correctly.
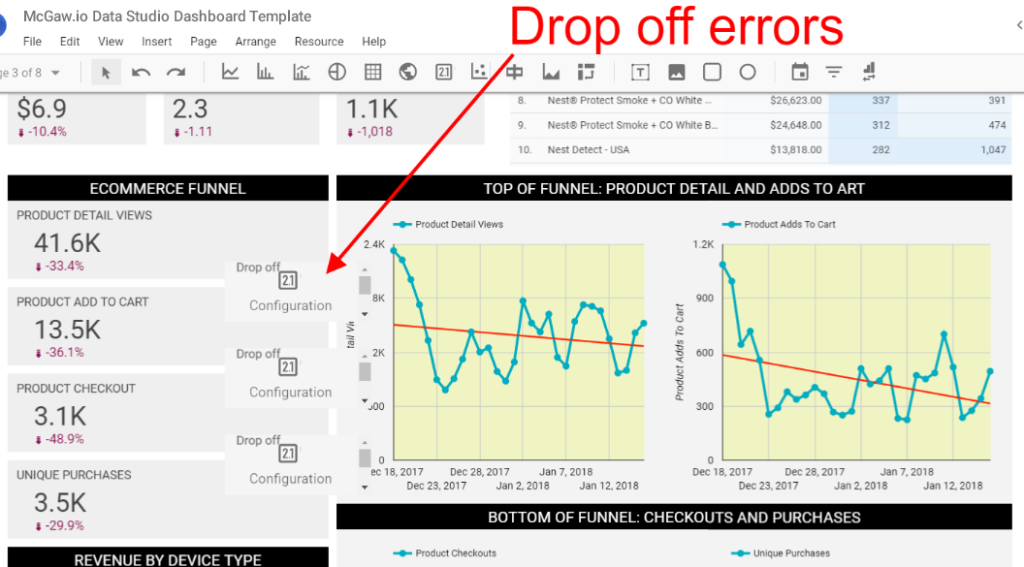
To fix this we need to add the following calculated metrics to our dashboard:
- Product Detail Drop Off
Calculation: (Product Detail Views – Product Adds to Cart) / Product Detail Views - Product Add to Cart Drop Off
Calculation: (Product Adds to Cart – Product Checkouts) / Product Adds to Cart - Product Checkouts Drop Off
Calculation: (Product Checkouts – Unique Purchases) / Product Checkouts
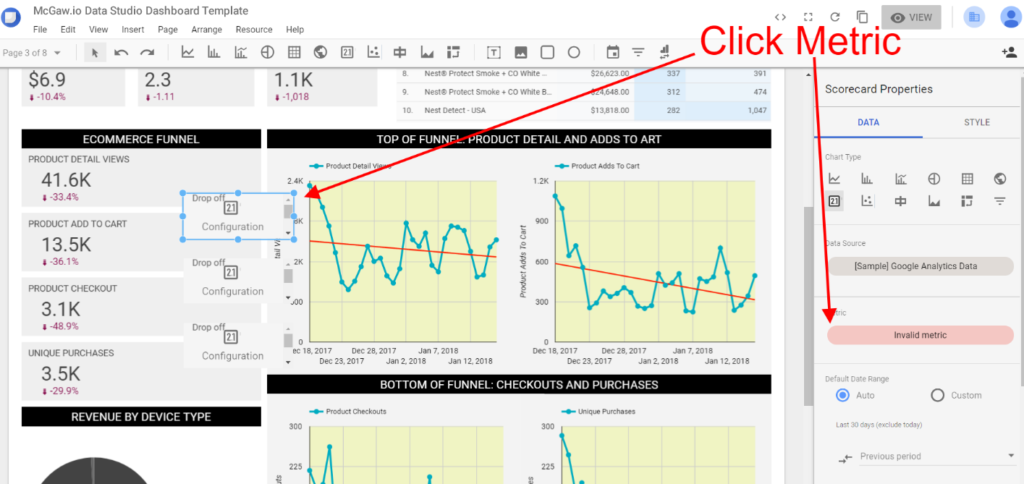
To add these metrics, click on the drop off metric next to the Product Detail Views and then click the Metric in the data properties panel.
Once you’ve done this, then click on the “Add New Metric” button at the bottom, and then click the “+” icon to start building the above mentioned drop off metrics. The end product should look like the screenshot below. (Note that you want all of these metrics to be percentages.)
Once you are done, go ahead and add the new metrics by clicking “Done”. These metrics will now reside inside of your Default Group in the Metrics drop down, shown below:
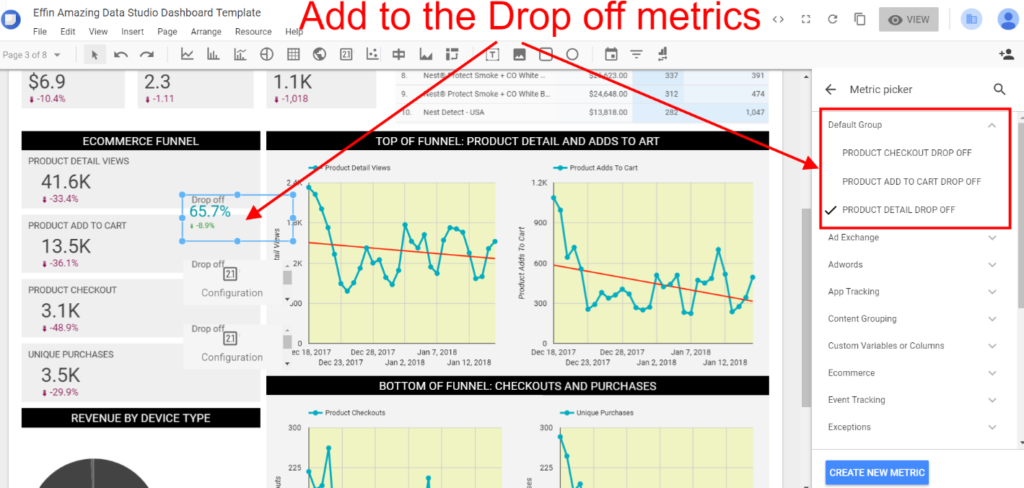
You can now add these metrics to the dashboard so that you can visualize the amount of drop off at each step of the ecommerce funnel.
Data Studio Dashboard Template – Acquisition, Behavior, Organic Search, and Adwords
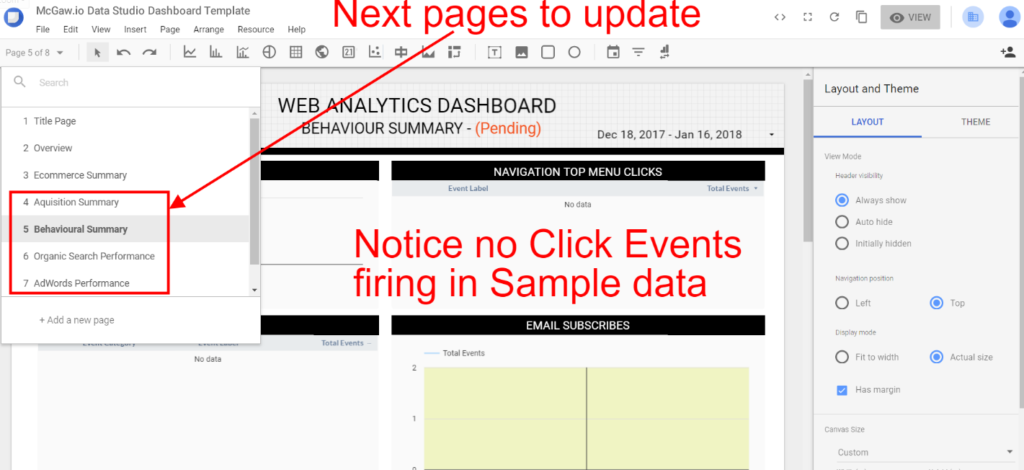
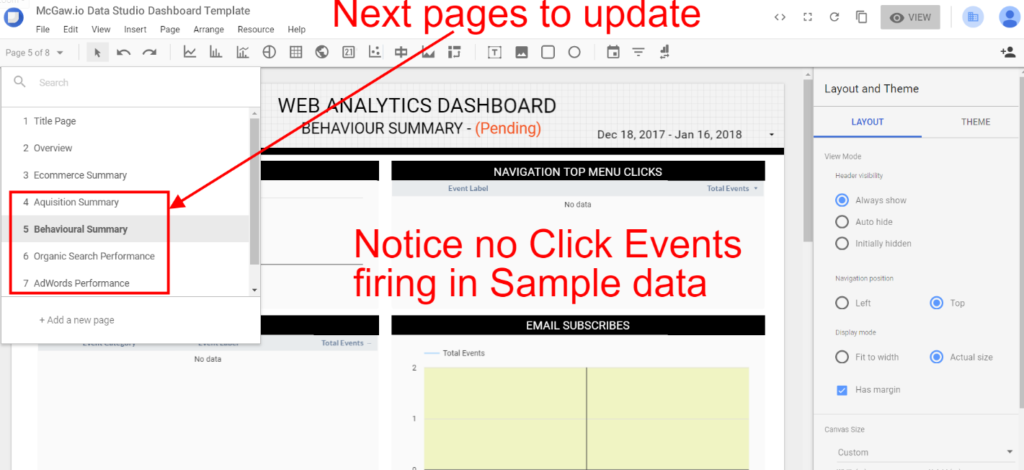
The next pages of the dashboard (4-7) are built around understanding how users are getting to your site, what they are doing on the site, and how your marketing efforts are performing. By walking through the first 3 pages of the dashboard you now have the skills necessary to update the following three pages.
Note that if you do not have Click Events built into your Google Analytics data, the Behavior Summary page will not work correctly. You can re-purpose this page for specific Goals on the site, or you can delete it.
Summary and Set Up Recommendations
Utilizing the template above you’ll get a great jump start into the world of Data Studio. Data Studio is a free dashboarding tool that integrates with many platforms, and I would advise trying it out to see if it will work for your company in all aspects of marketing.
Here is the full list of connectors available in the system:
- AdWords
- Attribution 360
- BigQuery
- Cloud SQL
- DCM
- Google Analytics
- Google Sheets
- MySQL
- PostgreSQL
- Search Console
- YouTube Analytics
There are also a lot more connectors available in the Explore Connectors database shown below.
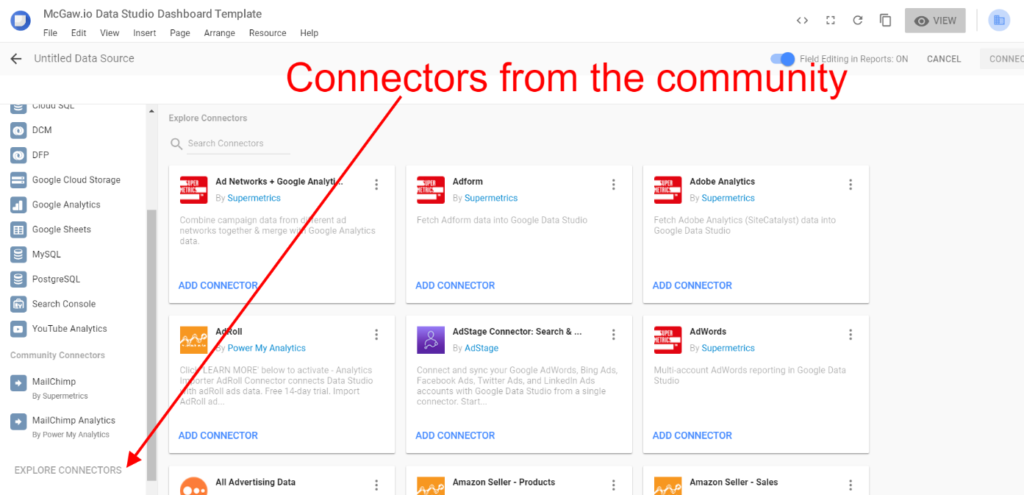
Some of these work great, but most do not. I would suggest trying them out, and if they work for your report your dashboard will become all the more powerful.
As always, if you need help setting up Data Studio to work for your company or any other part of Google Analytics, feel free to reach out to us. We offer our clients a full suite of analytics services to help them build a data driven foundation, one of the keys to impacting future growth.
Hi Mike,
Nice work on this post! I’ve been using Data Studio for awhile now and it’s allowed me to reduce the amount of time I spend pulling daily, monthly & quarterly reports. It’s an awesome tool!
First time here, but I wanted to chime in and add my two cents.
Hi Dustin,
Thank you for the great response! I love Data Studio, it’s definitely a game changer when it comes to reporting.
Hope you continue to get a lot of value from it!
Mike
Hi Mike,
I totally agree! There is one feature I’ve been begging them to get & I wonder if you’ve run into this.
I have a bunch of scorecards on my dashboard & I want to take the results of 2 scorecards and create a formula, so that I can get a %.
Example: One scorecard is made up of a GA segment for a specific landing page group. Another is made up of a different GA segment that identifies that same landing page group, but it includes a checkout pageview. I’m essentially building a funnel.
I just want to divide those two scorecards by one another, so that I don’t have to use a calculator or Google Sheets.
Have you ever needed such a feature & if so have you figured out a solution?
I have feature requests submitted to Data Studio & I’ve posted messages in the community & other people want it & nobody has found a solution.
No worries, if you haven’t just figured I’d ask.
Best,
Dustin
Hi guys! Nice post Mike!
Just a quick comment: several images seems to be broken and surely they are important for the post… :/
Can you check!?
Thanks a lot, great job!
Hey Javier,
Thanks for letting us know! I’m on it as we speak. :)
Kind regards,
Dylan