Last Updated on: July 28, 2026
Contents
What You’ll Learn
- How to scan your site and auto-detect your martech tools
- How to turn that list into a clean martech stack diagram
- How to map data flows so you can see how customer data moves
- How to spot gaps, overlaps, and tools to consolidate
- How Stack Builder helps you visualize your full stack in minutes
Key Takeaways
- Most martech stacks have 20-40 tools, far more than most teams can managem a stack diagram makes the sprawl visible and manageable.
- Stack Builder auto-detects your martech tools via email domain scan, then lets you drag them into a layered diagram showing data flows from collection to warehouse.
- A CDP like Segment placed at the center of your diagram often replaces costly middleware and enables identity resolution, personalization, and accurate attribution.
How many tools are in your tech stack? When I asked this during a webinar, most people said 5–10. In reality, most martech stacks have 20–40 SaaS tools, usually more than anyone can manage well.
Stack Builder makes it easy to visualize your martech stack as a complete diagram so you can see every tool, every connection, and every data flow. Too many tools mean wasted money, underused features, and messy data. Bad data breaks personalization, ruins attribution, and makes every report a debate.
That can change. You need to know what’s in your stack though, how tools connect, where data silos live, and see it all in one visual. PowerPoint diagrams don’t cut it. That’s why we built our free Stack Builder. It scans your site for marketing tools, helps you visualize your stack as a clear growth stack diagram, and gives you an inventory of tools where you can add costs, renewals, and owners.
Get your tools onto the canvas, connect them with arrows to show customer data flows, and finally have tech stack clarity.
A clear stack diagram makes it easier to explain your tools and data flows to your leadership team when they need clarity or budget decisions. If you already know you have stack sprawl and want an expert eye on it first, McGaw offers a free tech stack audit as a starting point.
Executive Summary
- See your full martech stack in one visual map
- Spot gaps, overlaps, and tools you can cut or consolidate
- Trace your customer data flows, and where it gets siloed
- Plan your cleaner, more effective stack right inside Stack Builder
- Track pricing, renewal dates, and owners in one place to support budget talks
How to Know What Martech Tools Are in Your Stack
Begin by adding your work email to the Stack Builder and clicking Submit. The builder uses your email domain to scrape your company website and detect what technologies you’re using. It can’t see server-side tech, or tech not installed on your website.
For this demo, we used Global Knives, a well-known B2C ecommerce brand.
What you’ll see is a rough draft of your stack arranged in no particular order. It’s a starting point, not a map of your data flow. You’ll need to rearrange things for clarity.
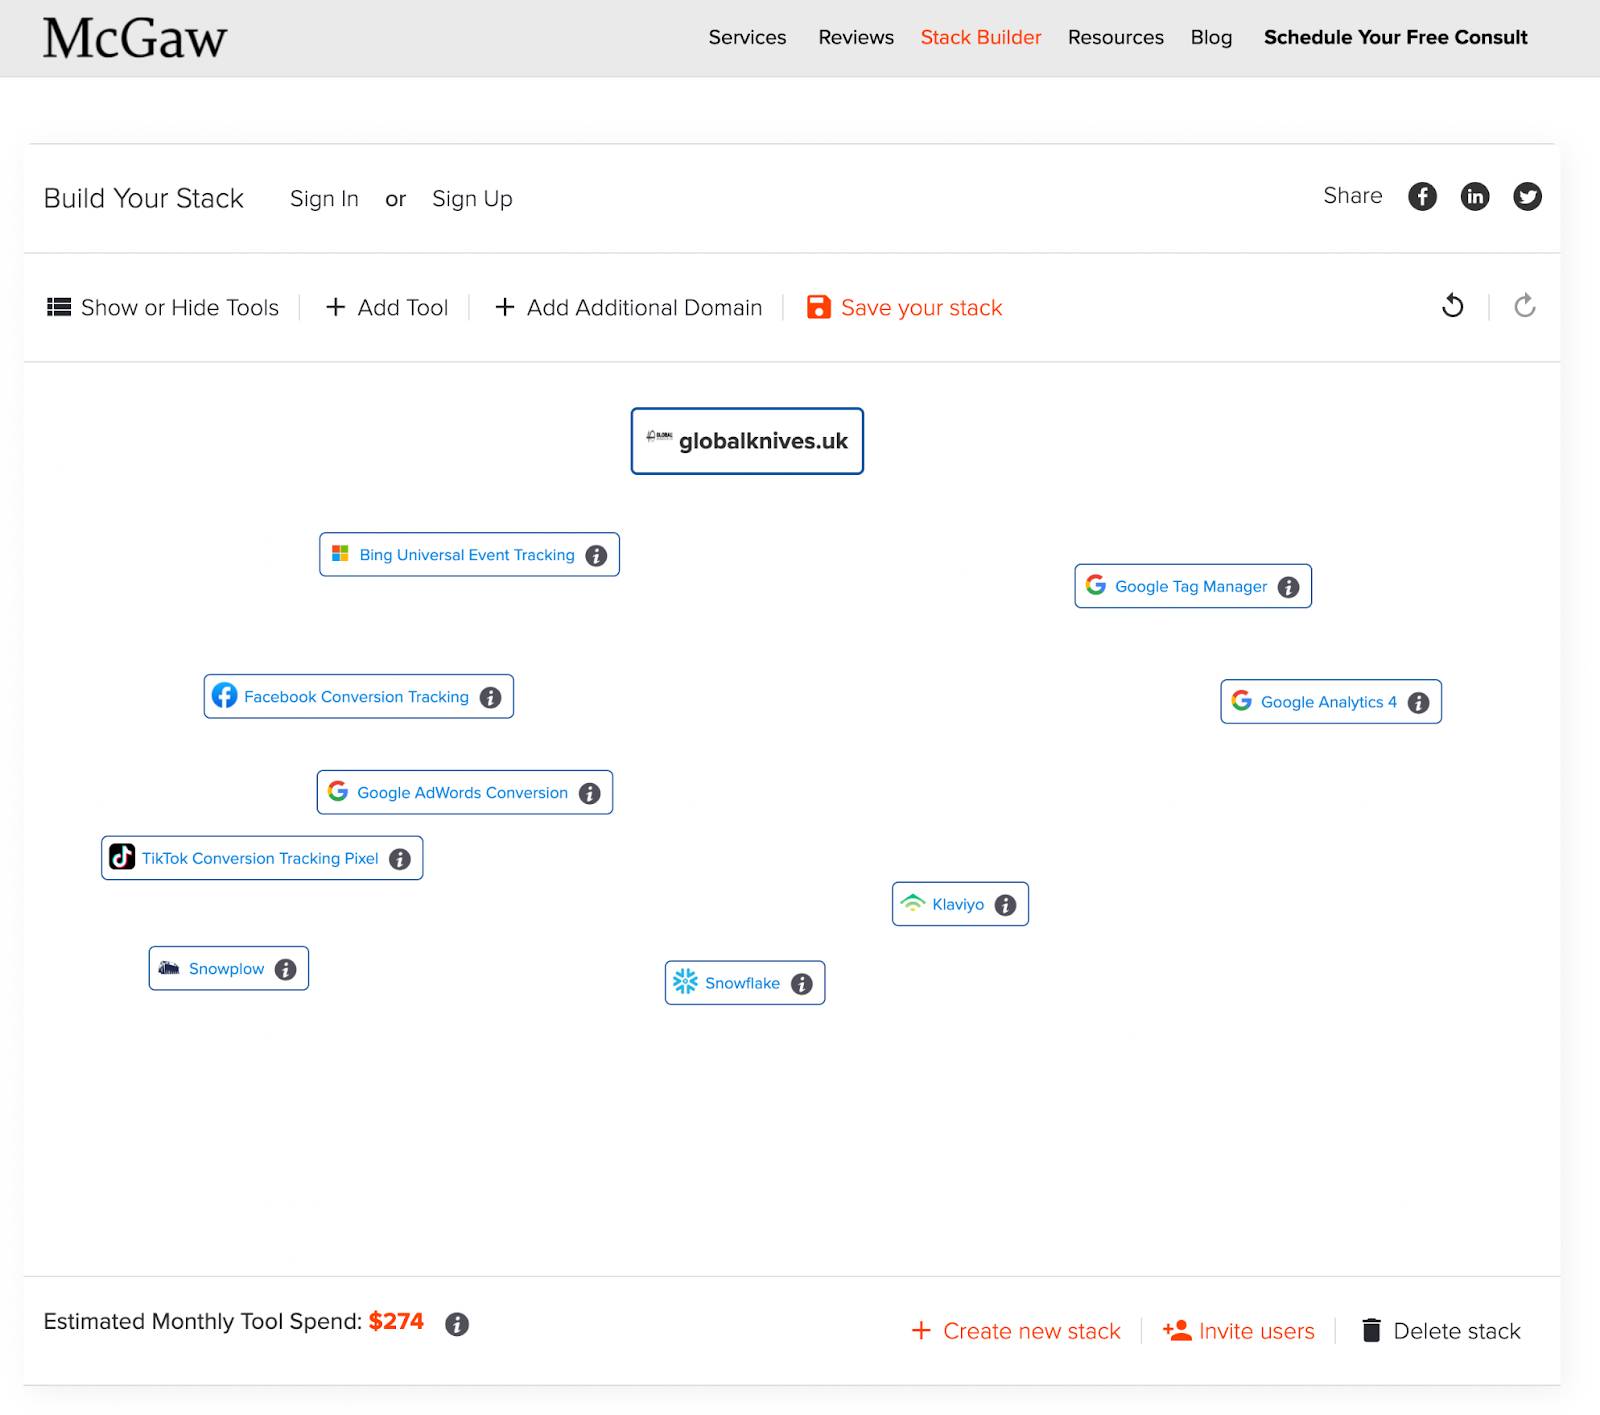
How to Visualize Your Martech Tools in a Stack Diagram
This is where your martech stack diagram starts to take shape.
Arrange your tools to reflect how data flows through your stack.
The drag-and-drop WYSIWYG interface makes this easy. To move them, just click and drag.
We recommend laying tools out so you your data flows down through your vertical stack, but shows your horizontal stack as well.
Simply put, you have a vertical stack with the top being where data is collected on your site or mobile apps. Data then passes down through all sorts of tools, the middle being the activation layer (horizontal stack layer), and the customer data ultimately flows to the bottom, where your data warehouse, BI tools, and some of your analytics tools might sit. In the horizontal stack, this is where your stack is spread, possibly horizontally for tools in a department like marketing, and on a layer lower, possibly the sales stack.
This helps when explaining your stack to an executive. It is easier for them to understand data as an assembly line that goes from TOFU to MOFU to BOFU. I will show you later in this post.
Either way, the idea is that data flows top-down. But when there is a myriad of tools working in harmony, for a department, those usually cluster together in a horizontal layer. It will make more sense in the diagrams below.
Check out Jon Miller, Founder of Marketo and DemandBase, on my podcast to get the full deep insights.
Tools go in this layout overall:
- Top: Websites and mobile apps at the top
- Left side and below above: Ad Tracking pixels
- Middle of canvas: Tag managers and Customer Data Platforms
- Same level as Ad tags and Tag managers, but on the right: Automation and infrastructure on the right
- Right side, and lower, but above Warehouse layer: Analytics tools
- Bottom center: Data warehouses and BI
This layout helps illustrate how tools might be organized on the canvas:
[baf-ms250]
How to Diagram Your Martech and Customer Data Integrations
To connect tools, click the green edge of a tool tile, and an arrow will appear. Drag the arrow to show where the data is sent to. Arrows flow from the first tool (source) to the second (destination), and you can select to have one-way arrows, or two way arrows for tools that sync bidirectionally.
We will show how to add missing tools a little later.
To delete a connection, click the arrow and choose Delete Arrow in the toolbar.
In this stack, data is flowing from the top, from the website to lower Google Tag Manager and to Snowplow CDI (customer data infrastructure).
As we mentioned earlier, ad pixels are off to the left in the middle. GTM is sending conversions from the site to the ad platforms. GTM is also piping this same data client-side to Snowplow, which ends up downstream in Snowflake, the Snowflake DWH (data warehouse)
For this client, they have Klaviyo directly on the site, but as we can see, in the horizontal layer, it is also sending customer data to the ad platforms. This is their audience for ads.
As we go lower, Google Analytics 4, which is downstream of GTM and Snowplow, but also sending data downstream to Snowflake.
How to Add Tools to Your Martech Stack Diagram
To add a missing tool, open Add Tool in the top menu, type the name, and click it to add it to your stack. If it is not in our database, you can create it as well.
How to Hide Tools from Your Martech Stack Map
Tools can’t be permanently deleted, but you can hide them. Just mouse over and click the red X to hide it. If you want to bring it back, click Show or Hide Tools, then toggle visibility by clicking the eye icon.
Tools are organized by category to make this easier, but don’t be afraid to use Command+F to search the page to move fast.
How to Add Additional Domains or Mobile Apps to Your Stack Visualization
If your stack spans multiple domains, subdomains, or has mobile apps, add them using Add Additional Domain or App in the top menu. For new domains, it will pull in its tools if not already on the canvas, so no duplicates.
If you need a duplicate, hit add tool and you can add another version of the tool if you have two instances of a tool across multiple domains.
How to Build a CDP Tech Stack Diagram
CDPs (Customer Data Platforms) often control much of the data in and out of tools and become the center of the stack. Since the CDP is connecting all the different tools, sometimes just to pipe data, and other times creating a single view of a customer for activation across the martech tools. It can have many connections to and from, and be more difficult to lay out.
If you need help, shoot me a note and we can either jump on a quick call, or I can send you a Loom for what I would do.
CDPs can be integrated simply, with low lift, and be very helpful. Or they can be well integrated into everything and handle identity resolution, enabling a single customer view, which is more complicated but massively powerful for marketing activation, personalization, clean data, and reporting you trust.
A single view of the customer, though, is essential for:
- Advanced personalization
- Accurate attribution reporting
- Advanced Audience Management
- Actually understanding who your customer is
CDP Tech Stack Visualization Example
In this stack, Segment CDP is in the middle and connected to nearly every tool. Before, the client had 2-6 versions of a customer across 4-8 tools with an expensive piece of middleware they created, which blocked personalization of marketing and ad audiences and accurate attribution reporting.
They were spending $12k a month to maintain the middleware, but it could not create a single view of the customer across their:
- Website and landing pages
- Mobile app member management platform
- Dozen+ martech tools and or
- Data warehouse filled with rich offline customer data.
The CDP was set up to resolve a user’s identity from an anonymous user on the website, then connects it to the data the customer gives us across devices (ie. zero-party data), and then resolves this all to multiple IDs or attributes from other tools to create a single customer profile. You can resolve identities/profiles of a user and merge their profiles with things like their User ID from your database, Email, Phone numbers, addresses, name, car license plates, and more to create a single customer view. Go deep on this in our other post!
It all comes down to your use cases, your business model, and what you can use a an identifier.
Segment CDP serves as the data pipeline, collecting and feeding customer data and audiences wherever needed. Adding the CDP was a major martech transformation. They planned 12-24 months for the major transformation to be completed. McGaw had them ahead of schedule, integrated within 7 months, and activating 1-to-1 personalized ads nationwide in near real-time. This is just one of the multiple use cases delivering ROI from their CDP investment.
Over the next 2 years, the CDP will reduce their cost to acquire customers (CAC), increase retention (LTV) of current customers, and scale revenue.
If you’re planning a marketing stack transformation and want a team that has done 100+ CDP implementations, that’s exactly what McGaw does.
Takeaways
For you to succeed in marketing, you have to know your tech stack. From just trying to understand what you have, to planning a full-blown transformation. Visualizing your martech tool integrations, customer data flows, and cutting tools you should have months ago will accelerate your growth.
The stack builder gives you this quickly and at no cost.
If you need support with the stack builder. Want advice on your tool selections. Or want to grow your business with full-funnel optimization and modern martech. Get in touch!
Dan McGaw is the CEO of McGaw.io, one of the original growth hackers, and a 25-year MarTech veteran. He has personally overseen 100+ CDP implementations and led martech strategy for brands from Series A startups to Fortune 500 companies. McGaw.io helps marketing teams audit, design, and transform their full martech and data stack.
Cut waste. Connect your data. Start getting the wins you’re paying for.
Open the Stack Builder
Frequently Asked Questions About Martech Stack Diagrams
What is a martech stack diagram?
A martech stack diagram is a visual map of all the marketing technology tools your team uses, showing how each tool connects to the others and how customer data moves through them. It typically layers tools from data collection at the top (website, mobile apps) through activation and analysis layers down to your data warehouse or BI tools.
What’s the fastest way to diagram my martech stack?
Stack Builder auto-detects tools via your email domain and builds an initial diagram for you. From there, drag tools into position, draw arrows to show data flows, and you have a complete martech stack diagram in under 30 minutes.
How do I visualize my tech stack?
Use Stack Builder’s drag-and-drop canvas to arrange your tools into layers: collection at top, activation in the middle, warehouse at the bottom. Then connect tools with directional arrows to show how customer data flows between them.
Can I export my martech stack diagram?
Yes. Download the diagram as an image file or share the link directly with your team. No signup required to start building.
How many tools should be in a martech stack?
Most teams run 20–40 tools, but the right number depends on your business model and team size. The bigger issue is usually whether those tools are integrated and whether data flows cleanly between them. A martech stack diagram helps you spot redundancy and gaps fast.
When do I need a CDP in my martech stack diagram?
You need a CDP when you have customer data spread across 4+ tools with no single customer view, when personalization is blocked by fragmented identities, or when attribution reporting is unreliable. A CDP like Segment sits at the center of your stack diagram, connecting data in and out of every tool and resolving identity across devices and channels.
How is a martech stack diagram different from a tech stack diagram?
A tech stack diagram covers all software a company uses, including engineering, product, and ops tools. A martech stack diagram focuses specifically on marketing technology, data flows for customer data, and how tools support acquisition, activation, retention, and revenue.
What does McGaw.io do with martech stack diagrams?
McGaw.io uses stack diagrams as the starting point for every martech audit. We map the current state, identify integration gaps and tool redundancy, then design the target state. From there, we implement, integrate, and optimize the stack, with a specialization in CDP implementations and full-funnel analytics.


Leave a Reply